
Solarwinds Database Performance Analyzer for MySQL
The Fastest Way to Identify and Resolve MySQL Performance Problems
License with 1st-year Maintenance
Our Price: $1,995.00
License with 1st-year Maintenance
Our Price: $1,945.00
License with 1st-year Maintenance
Our Price: $1,895.00
Click here to jump to more pricing!
Overview:
SolarWinds Database Performance Analyzer (formerly Confio Ignite) for MySQL is a comprehensive database performance monitoring and analysis solution for DBAs, IT managers, and application developers. Database Performance Analyzer eliminates performance bottlenecks, improves application service, and reduces the overall costs of database operations.
Database Performance Analyzer for MySQL at a Glance
- Identify SQL blocks and corresponding locks.
- View response time delays in real time, or the history up to weeks and months.
- Schedule graphical performance reports for delivery to any email address.
- Set proactive alerts to be notified of problems via email or SNMP trap.
- View database operations down to the second.
- Get expert advice to solve issues.
Key Advantages
- Resolution within four clicks. An alarm trail leads DBAs directly to the root cause of a problem in 3 - 4 clicks.
- Agentless. Less than 1% load on monitored servers, even during heavy monitoring periods.
- Multi-Dimensional Performance Analysis. Simplifies root cause analysis by correlating SQL statements, context, system and storage health, wait events, and response time
- Resource baselines, alerts, and reports. Proactively monitor system health, identifying trends before they become problems
- Detailed view of performance. Database Performance Analyzer correlates essential statistics to help explain query bottlenecks, server health, and how session statistics interact—providing a complete health and performance picture.
- Less finger pointing and more collaboration. DBAs, developers, and server teams have the same view of application performance on production servers.

Visibility into database operations down to the second
Know exactly what's happening in your database: wait times, plans, queries, resources and changes.

Less finger-pointing and more collaboration across teams
DBAs, developers, and server teams get access to a single and complete version of the truth.

Historical information, trends and dynamic baselines
Go back in time to find out the root cause of problems. Dynamic baselines identify anomalies to watch.

Multi-dimensional analysis isolates the root cause of issues
Correlate wait times, queries, users, files, plans, objects, and time to pinpoint problems.

Real-world performance from dozens or hundreds of instances
Agentless architecture with read-only rights is safe to use in production systems.

Get expert advice to solve issues
DPA provides expert advice on how to solve issues for professionals of all skill levels.
Features:
Focus On Wait-Based Analytics
Database Performance Analyzer is different because it focuses on database response time and finding the root causes of delays inside of MySQL. Database Performance Analyzer tracks every query in every active session and captures the MySQL thread states and wait events that impose delays on the query.
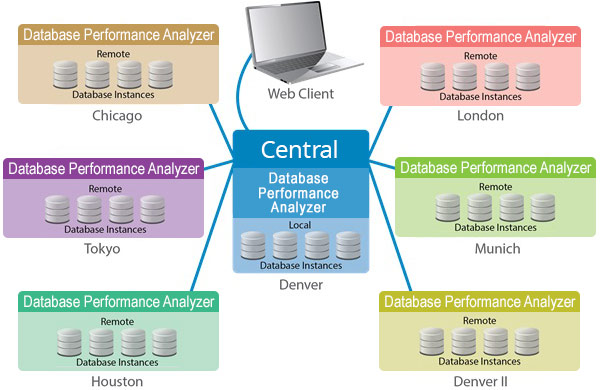
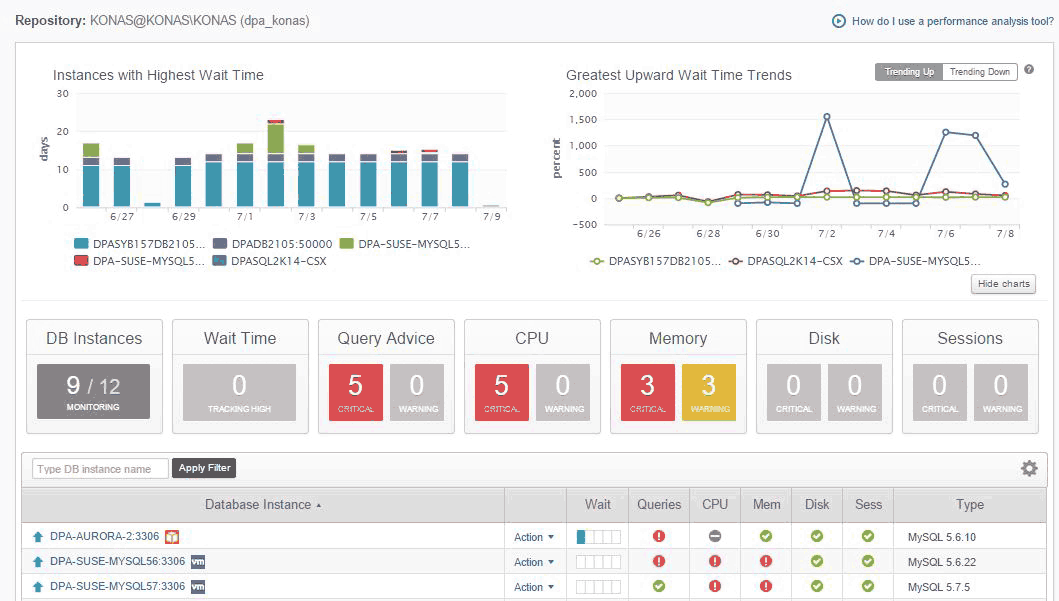
Unified View Into Hybrid IT Environment
Single Dashboard provides visibility across hybrid IT environments. Monitor and optimize MySQL, Oracle, SQL Server, DB2, and SAP ASE on physical servers, on VMware, and in the Cloud, including Amazon AWS EC2, RDS, and Azure. Database Performance Analyzer supports a mix of database engines and deployment options.
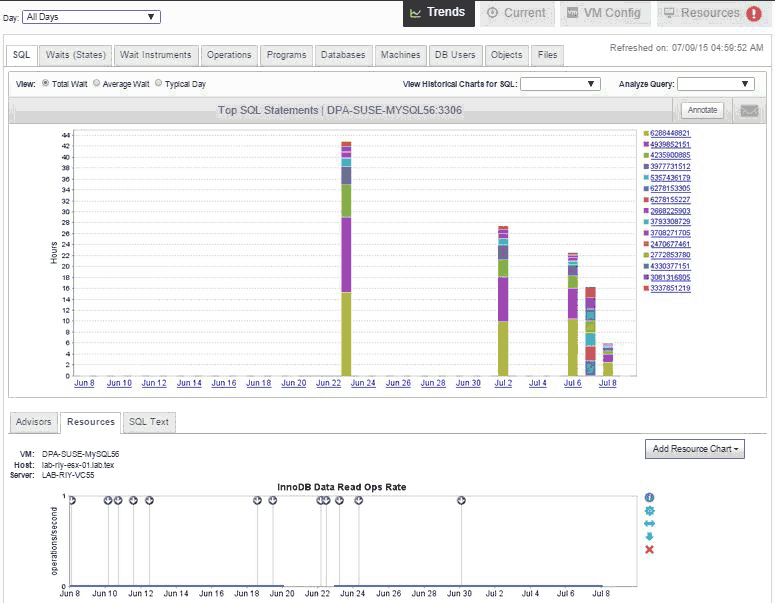
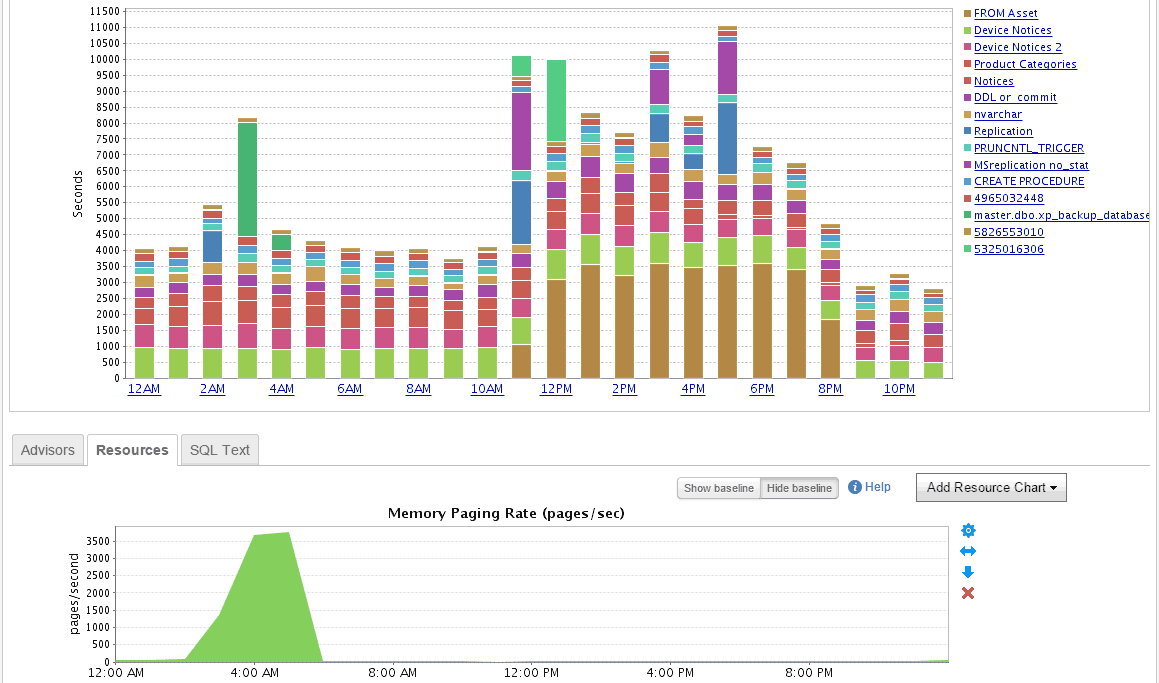
Historical Trend Analysis
Database Performance Analyzer captures multiple dimensions of response time and server statistics in the data warehouse repository. While many tools focus only on the current workload, Database Performance Analyzer uniquely analyzes repetitive clues that explain why the MySQL database response is slow. Dynamic baselines identify anomalies to watch out for. The graphical display makes it easy for anyone (DBAs, managers, and developers) to see the trends and patterns that tell the complete performance story.
Agentless Architecture
Database Performance Analyzer installs no software or agent on the monitored server, placing less than 1% load on the monitored database instance. Database Performance Analyzer server software is installed on a separate system, which can be any UNIX/Linux or Windows server, typically a test system under control of the DBA. Database Performance Analyzer data warehouse repository is configured on any Oracle or SQL Server instance, either on the same or different server as Database Performance Analyzer software. In multi-vendor environments, MySQL, SQL Server, DB2, SAP ASE, and Oracle databases can also be monitored from the same Database Performance Analyzer server.
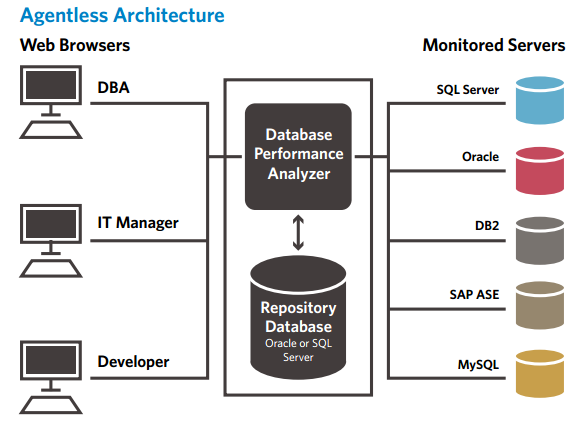
Database Performance Analyzer Agentless Architecture
Multi-dimensional performance analysis is an extremely fast way to identify the root cause of poor application performance.
With advanced wait-time analytics, stop guessing and drill down into your MySQL to find the exact cause of performance bottlenecks.
Single dashboard provides a view across hybrid IT environments and supports a mix of database engines and deployment options
Optimize MySQL, Oracle, SQL Server, DB2, and SAP ASE on-premises, VMware, and in the Cloud, including AWS EC2, RDS and Azure agentless architecture. Safe to use in production
Proactively manage MySQL with automated reporting and alerting
Proactive monitoring and automated alerts help warn you whenever performance degradation occurs.
Identify normal operating thresholds with resource metrics baselines.
Resource metrics baselines help you identify the server's contribution to poor database performance.
Tuning advisors provide clear and actionable advice
Tuning advisors point toward problems that need immediate focus, and provide clear, actionable advice.
View DPA analysis and metrics within SolarWinds Orion interface.
Get database performance in the context of specific applications inside SolarWinds SAM.
System Requirements:
| Hardware | Minimum Requirements |
|---|---|
| CPU | Dual-core |
| Memory | 4GB |
| Hard Drive | 3GB / monitored instance |
| Software | Minimum Requirements |
| Operating System | Windows, Linux or UNIX |
| Supported Instances | MySQL 5.6+ Oracle 11g, 12c SQL Server 2008, 2012, 2014 SAP ASE 15.0x, 15.6, 15.7, 16 DB2 9.x, 10.1, 10.5 VMware ESX/ESXi 5.1, 5.5, 6 |
| Java Virtual Machine | 1.6 or 1.7 |
| Database Repository | Oracle 11g, 12c SQL Server 2008, 2012, 2014 |
| Web Browser | IE - 8, 9, 10, and 11, Firefox 3.6 and higher, Chrome latest version. |
NOTE: System Requirements specified are for less than 20 monitored instances, additional resources may be required for larger deployments.
Screenshots:
Resource metrics baselines
Identify normal operating thresholds with resource metrics baselines
No agents and no load
Scalable, agentless architecture
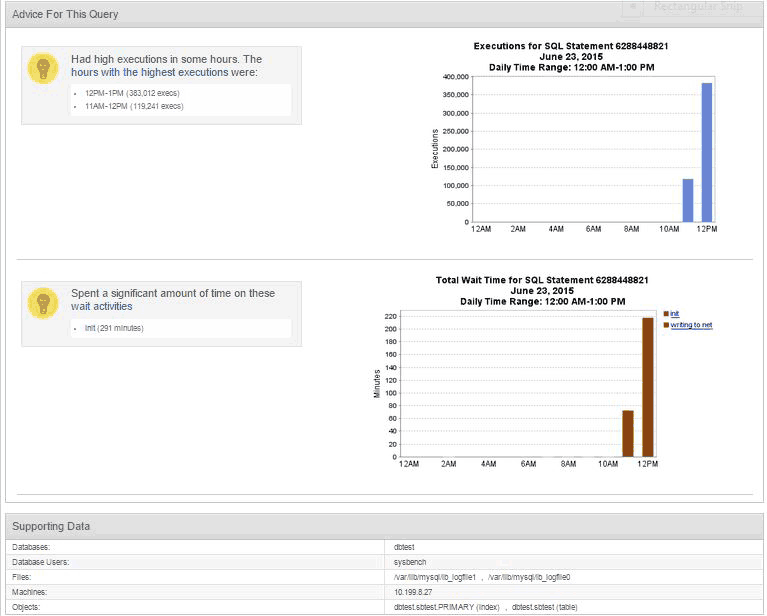
SQL query tuning
Database Performance Analyzer isolates root cause and provides needed tuning advice
Isolate root causes by performing multi-dimensional analysis
Get to the root cause of SQL Server performance issues without getting lost in statistics
View VMware infrastructure
See details of how the VMware infrastructure impacts Oracle database performance
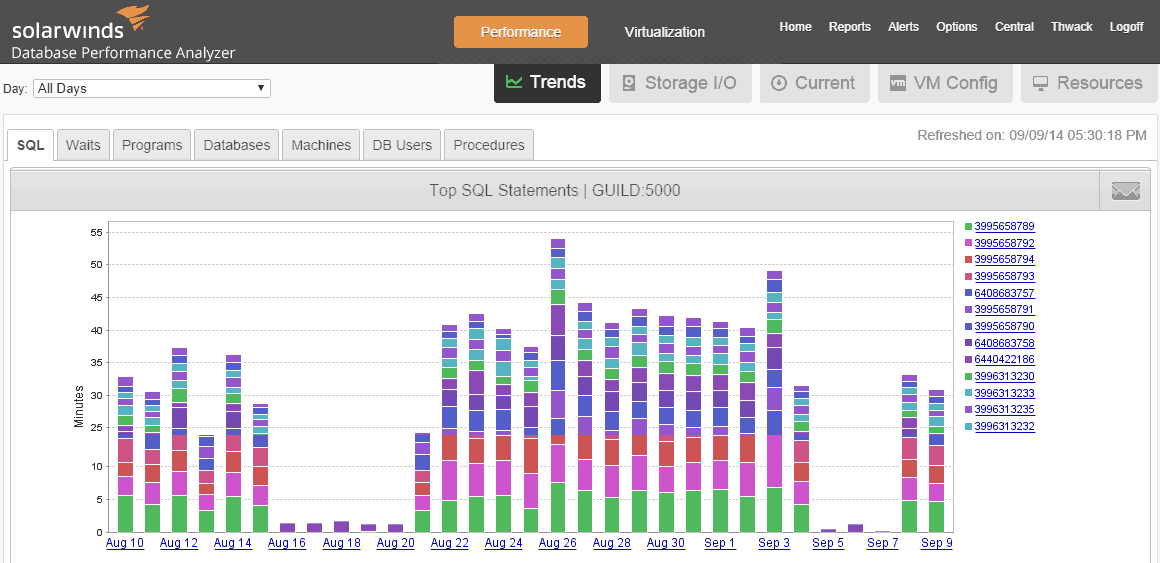
Get historical trends of MySQL activity
DPA's historical repository highlights the trends and anomalies that are easy candidates for tuning
Documentation:
Download the Solarwinds Database Performance Analyzer for MySQL Datasheet (.PDF)
License with 1st-year Maintenance
Our Price: $1,995.00
License with 1st-year Maintenance
Our Price: $1,945.00
License with 1st-year Maintenance
Our Price: $1,895.00
License with 1st-year Maintenance
Our Price: $1,795.00
License with 1st-year Maintenance
Our Price: $2,845.00
License with 1st-year Maintenance
Our Price: $2,770.00
License with 1st-year Maintenance
Our Price: $2,695.00
License with 1st-year Maintenance
Our Price: $2,545.00