
Solarwinds Redis Monitoring Tool
Monitor every query and metric to improve Redis performance
Overview - Database Performance Monitor:
Open-Source Database Performance Monitoring
Database Performance Monitor (DPM) provides deep database performance monitoring at scale, without overhead. Our SaaS-based platform helps increase system performance, team efficiency, and infrastructure cost savings by offering full visibility into major open-source databases including MySQL, PostgreSQL, MongoDB, Amazon Aurora, and Redis.
Features Overview
- 24/7 monitoring, for both real-time and historical analysis
- One-second granularity helps you spot and diagnose small performance issues
- Compare queries, databases, and more with custom side-by-side views
- Comprehensive database performance analytics include query samples and explain plans
- Weekly and daily summary reports and customizable alerts
- Unified view of all your database types and servers to understand your system
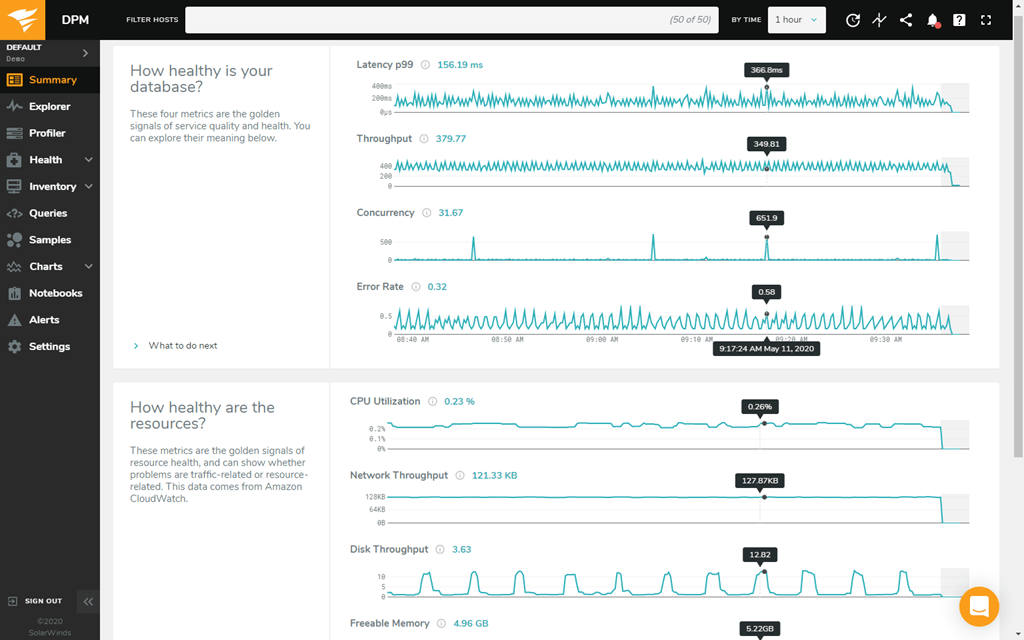
- Meaningful summaries show you golden signals of service quality and health for database and system performance
Database Support
Features - Redis Monitoring Tool:
Monitor and optimize Redis queries with the help of a Redis monitoring tool
Visualize the data you need to pinpoint Redis performance issues with SolarWinds® Database Performance Monitor (DPM). DPM is built to measure throughput for every single query executing in microsecond resolution.
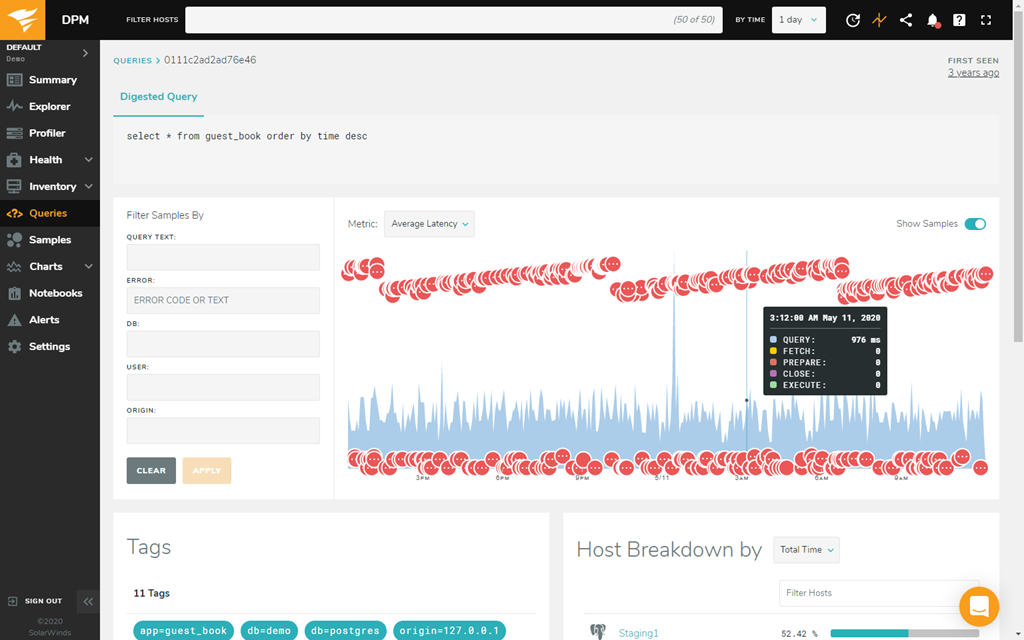
Built-in features like Top Queries are designed to show a master-detail view across all servers in your application, with per-second drill down into samples of queries and cross-correlations with other metrics. Drill down, thin-slice queries, and compare across time periods quickly for before-and-after change analysis.
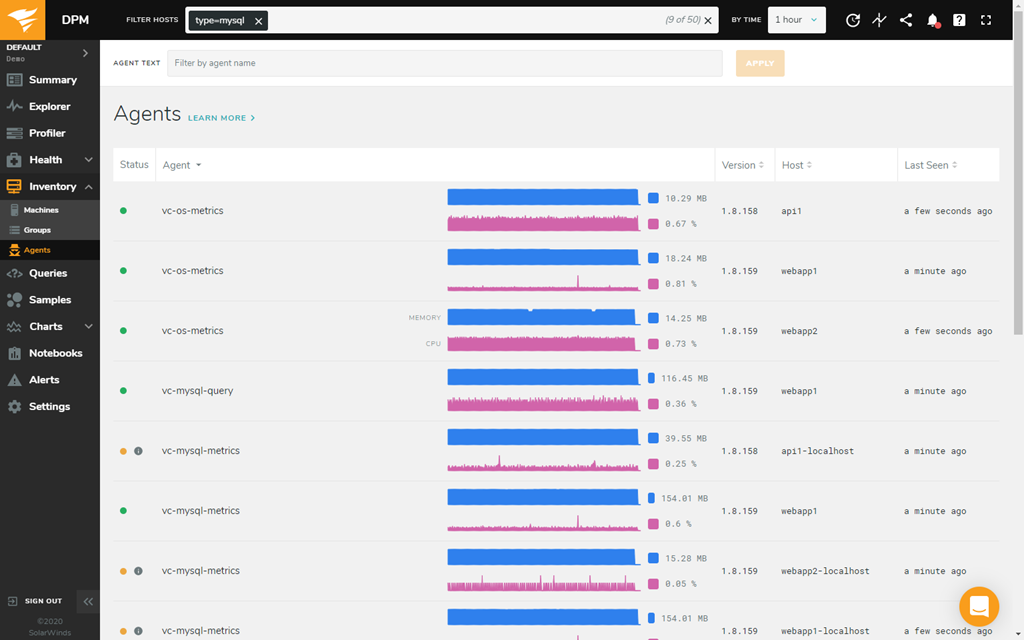
Collect a wide range of Redis metrics
SolarWinds Database Performance Monitor measures a broad set of metrics about your system and is built to collect up to 10,000 metrics a second from every server on your system. In addition to every metric exposed by Redis—including key metrics tied to memory, performance, and persistence—DPM monitors and classifies multi-dimensional data on other system components. When you have a problem, even if it only lasts a second or two, you'll have the data you need to diagnose and solve it fast.
Get cloud-based monitoring with an easy, efficient Redis monitoring tool
DPM is a Software as a Service (SaaS) solution, so there's nothing to provision, buy, or maintain. DPM is updated and upgraded continuously, so you get new features automatically. DPM’s agents for Redis monitoring are completely passive, using techniques such as network traffic capture and inspection of system views. They’re safe, with data encryption in-flight and at-rest, and no inbound network access is required. The agents are built to be efficient and resource constrained, using less than 1% CPU.
Discover adaptive fault detection and big data analytics for Redis performance monitoring
DPM’s big data analytics platform for Redis performance monitoring uses advanced techniques such as regression analysis and queueing theory to deliver unmatched insight—including zero-configuration detection of micro-fine server stalls, the relationship between queries and CPU or I/O, and more. DPM’s adaptive fault detection technology helps you find and address faults before they become outages. This means fewer performance interruptions and a better user experience.
Make the most of cross-functional teams for monitoring Redis
DPM is designed for cross-functional teams. It enables application developers, DevOps, and DBAs to work together via a collaborative tool for problem-solving. Easy integration with chat, deep-linking, quick sharing, and other features make it a snap to show your teammates exactly what you're looking at. Use DPM in development and staging to catch problems before they're released to production.
Key Benefits:
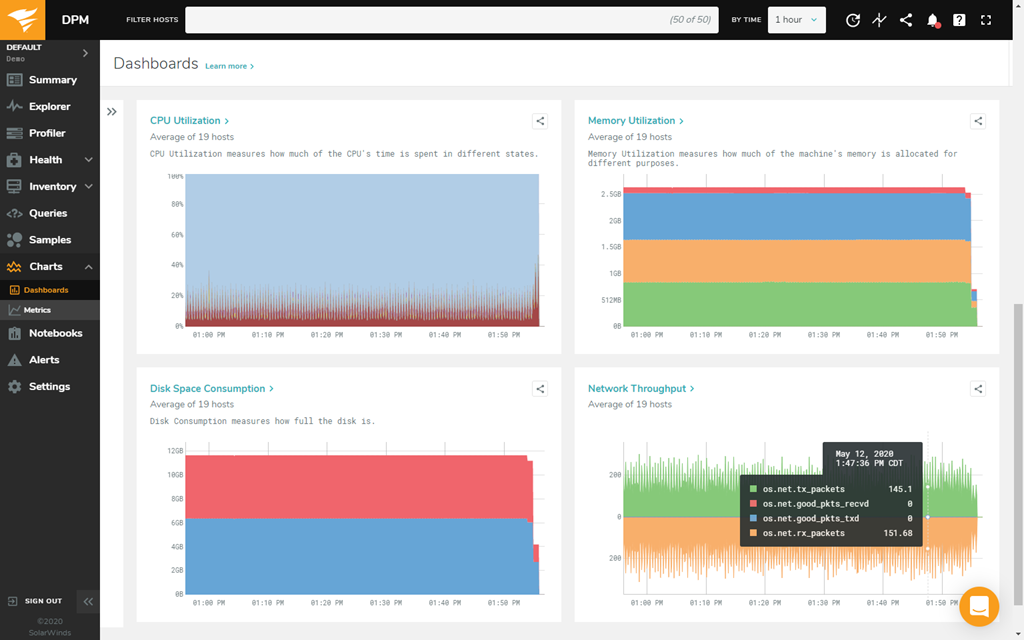
- Visualize thousands of collected metrics across thousands of databases with simple-to-create and -share charts
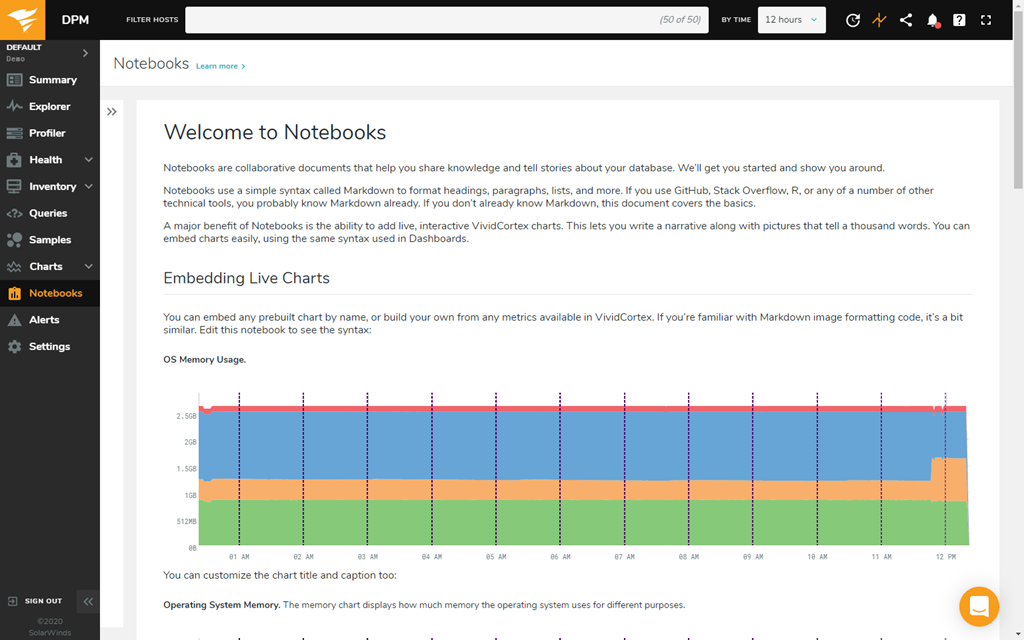
- Cross-functional team workflow is facilitated with notebooks to create and share knowledge
- Optimize resources and reduce database incidents with one-second resolution into workloads
- Ship better code
- See query response before and after a deployment event
- Examine query details and performance including samples and execution plans
- Compare the performance of your top queries over time
- Troubleshoot and diagnose outages
- Correlate query response or behavior to system metrics to understand impacts
- Isolate unusual behavior and potential contributing factors within the database
- Understand database health
- Track metrics and watch for trends with health summary for databases and systems
- Get recommendations based on best practices
- Explore and examine performance outliers
Details:
- Support for physical, virtual, and cloud-based databases, including AWS RDS
- Architecture
- Secure, cloud-hosted platform
- In-flight and at-rest encryption
- Role-based access control, single sign-on, and SAML integration
- Configurable option to filter customer sensitive data
- Built on the International ISO/IEC 27000 family of standards
- GDPR compliant along with SOC 2 Type II certification
- Alerting and integration module allows for injection warnings to be transmitted directly to email, Slack, Victorops, or any number of messaging systems
Redis key metrics:
A large number and variety of metrics need to be tracked as part of Redis performance monitoring. While there are too many metrics to list them all here, there are five main categories of metrics at the core of Redis performance. These categories are:
- Performance metrics such as latency. Latency reflects the time between a client request and when the server responds to the request. Redis is structured in such a way that even a single outlier in your latency distribution can create major bottlenecks. In fact, long response time for a single request will increase the latency for all the subsequent requests, meaning it’s critical to catch latency as soon as it occurs in Redis. Monitor database metrics tied to performance to catch latency early.
- Memory metrics such as used_memory. Making sure your used memory is less than the total system memory is critical for maintaining the fast speeds Redis is known for. If the used memory exceeds the system memory, the operating system will start swapping sections of memory that are then written to disk. This process is around 100,000x slower than reading or writing from memory. Since data is stored through main memory in Redis, these metrics are even more important than usual with a Redis database. A Redis monitoring tool can help you keep track of all the memory metrics you need, including cache hit ratio, blocked clients, memory fragmentation ratio, and evicted key stats.
- Basic activity metrics such as connected_clients. Redis has both an upper and lower limit for its number of connected clients. Checking this metric helps you see if the number of clients leaves the normal range, which can be an early indicator of a problem within your Redis system. Too many or too few clients might mean the server’s ability to handle requests is getting overwhelmed or upstream connections are getting lost.
- Persistence metrics such as rdb_last_save_time and rdb_changes_since_last_save. Persistence is important in Redis because it keeps you from having the replicas copy empty datasets whenever the primary restarts. Monitoring these metrics helps you track the volatility of your data set. They can also give you a good sense of how much data you might lose should a failure occur.
- Error metrics such as ejected_connections. When your client connections exceed your pre-set maximum, they will be ejected. Error metrics, like ejected connections, help you ensure you aren’t exceeding your limits and help you adjust limits as needed. A Redis monitoring tool will alert you whenever these metrics require your attention.
Screenshots:
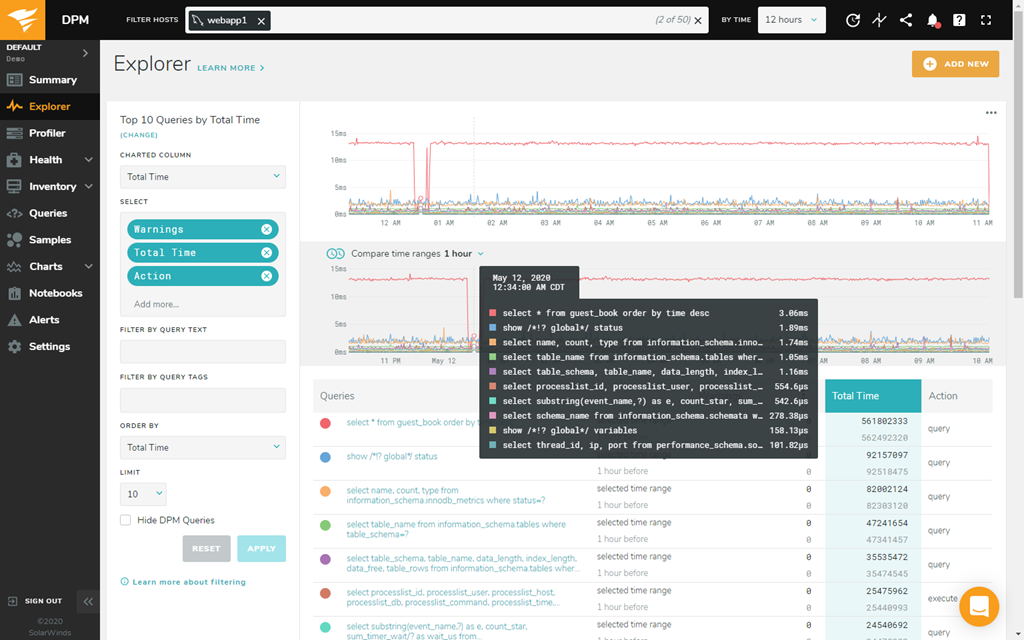
DEPLOY CODE WITH CONFIDENCE
Compare query and system performance with before and after charts, and quickly search for newly introduced queries
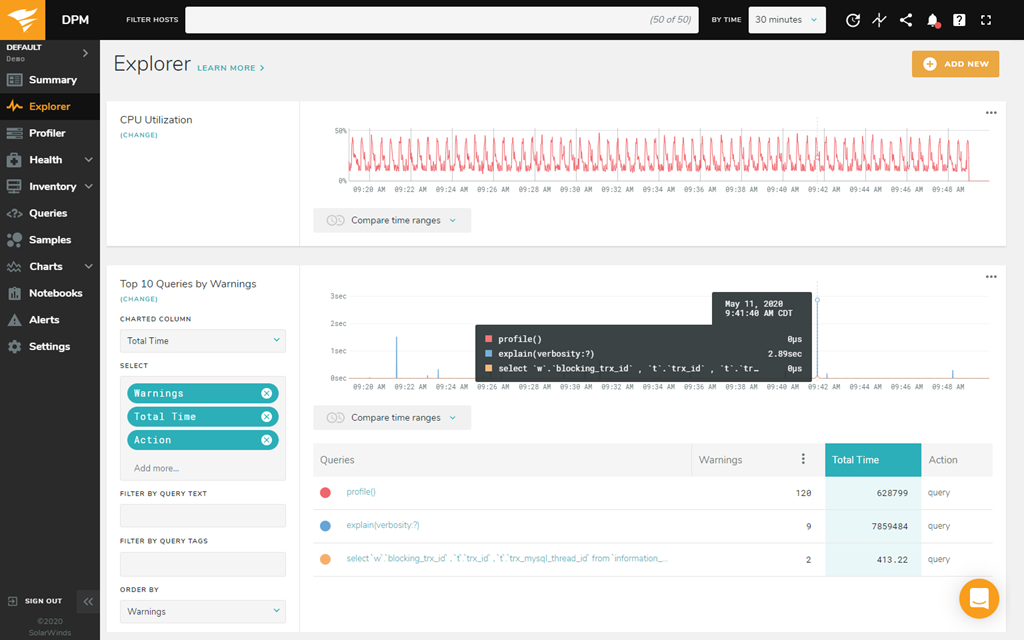
TROUBLESHOOT AND DIAGNOSE PERFORMANCE ISSUES
Visualize and correlate query behavior to system metrics to help troubleshoot performance issues and impact
What is a Redis database?
Redis serves as an alternative to traditional disk-based databases. It’s predominantly known for its speed, easy onboarding, flexible data structures, and general performance quality.
The difference between Redis and a standard database is the way Redis stores data as key-value pairs containing strings, lists, hash sets, and sorted sets. Because of this, Redis is defined as a key-value store instead of an outright database. In addition to acting as a database, Redis can also act as a cache or message broker.
Redis achieves its outstanding performance—and its high speeds in particular—by using an in-memory dataset. It can run atomic operations like finding and retrieving members in a list, appending strings, computing set intersection, union and difference, incrementing hash values, and more.
Redis also supports a primary-replica architecture, delivering rapid non-blocking first synchronization, asynchronous replication, and auto-reconnection with partial resynchronization on netsplit. It’s written in ANSI C, though it supports most programming languages.
One of the key features of the Redis database that makes it stand out is Redis Cluster. Redis Cluster lets you run a Redis installation where data is automatically shared across multiple Redis nodes. It also lets you continue operations even if some nodes can’t communicate at the moment or even if they fail entirely. Your operations won’t get stalled because of a few problematic nodes.
Redis has a few advantages over and differences from standard databases. Because of that, it necessitates constant Redis performance monitoring—particularly Redis Cluster monitoring—to maintain performance and catch issues before they have a significant impact on end users.
How to monitor Redis database performance
Redis performance monitoring, which includes Redis cluster monitoring, Redis queue monitoring, and more, is a process involving tracking key metrics and queries to prevent bottlenecks or other performance disruptions. It helps you catch problems in two key areas: issues with resources in Redis itself and problems elsewhere in your infrastructure with an impact on Redis performance.
The first step of any database monitoring plan is determining what exactly needs to be monitored. For Redis performance monitoring, you want to ensure you have insight into:
- The health of the underlying infrastructure
- The health of the data source and all its processes
- The success and performance of the queries being executed
- The conditions typically at fault when problems occur, so you know where to direct your interventions
With Redis, monitoring database performance involves collecting and analyzing key metrics tied to everything from memory and persistence to errors and basic activity. Since the Redis database management system relies on main memory for its data storage, memory metrics are particularly important. These include stats like used memory, cache hit ratio, memory fragmentation ratio, blocked clients, and evicted key stats.
When it comes to Redis queue monitoring, network traffic is another important metric. An unexplained change in traffic could indicate broken connections between the application and the data source. This can translate into a drop in performance if the issue isn’t addressed quickly.
With so much to keep track of and so much on the line if a problem slips through the cracks, it’s imperative for anyone using Redis as a database to use a Redis monitoring tool. A tool can monitor your key Redis metrics down to the second and keep track of your queries, measuring throughput for every single executing query.
How does Redis monitoring work in DPM?
SolarWinds Database Performance Monitor (DPM) is a user-friendly Redis monitoring tool designed to help you reap the benefits of database monitoring without breaking the bank. DPM offers 24/7 monitoring and performance analysis to help you identify and address issues as they arise—before they have a significant impact on the user experience.
As with any Redis monitoring tool, the most important element of DPM is its ability to monitor key metrics. Database Performance Monitor is built to capture more than 10,000 metrics every single second from each system the tool is monitoring. This level of granular data collection makes it easier to troubleshoot and resolve problems fast.
Managing queries is another key element of Redis performance monitoring. DPM’s Top Queries view gives a master-detail view of all the servers on your system, letting you conduct per-second drill-downs into cross-correlations with other key metrics like I/O and CPU, samples of queries, and EXPLAIN plans. DPM is built to help you drill down from a global view to a single query within seconds, so you can get to the bottom of potential issues.
DPM’s adaptive fault detection technology helps you resolve problems fast by detecting faults before they have a chance to grow into significant outages later. Detecting the smallest faults means fewer interruptions and better performance overall.
In addition to keeping the database running smoothly as a Redis Cluster monitoring tool, DPM also includes features designed to help you optimize Redis database performance. It helps you tune your database tables, check queries in aggregate, and figure out whether your database is functioning at its expected performance level.
Documentation:
Download the Solarwinds Database Performance Monitor Datasheet (.PDF)
Get in touch with a Solarwinds Solutions Specialist today to Learn More!