Solarwinds ipMonitor
Essential up/down and performance monitoring for networks, servers, VMware® hosts, and applications
Overview:
Essential up/down and performance monitoring for networks, servers, VMware hosts and applications
Do you know what’s going on right now with all the network devices, servers, and applications that are the magic behind your business? To keep on top of what’s happening with all of those moving parts, you need an easy-to-use, reliable monitoring solution that tells you what’s up, what’s down, and what’s not performing as expected.
SolarWinds ipMonitor is designed to deliver out-of-the-box, visibility into essential availability and performance metrics for your critical IT environment. Plus, ipMonitor includes a built-in database and web server, so you don’t need to install anything but ipMonitor—making it fast, lightweight, and affordable.
ipMonitor Highlights
- Quickly discovers infrastructure and recommends SmartMonitor settings— designed to make setup simple and fast
- Provides an easy-to-use web interface and network maps for clear, at-a-glance views of your environment
- Sends customizable alerts and reports to help ensure you are the first to know about network issues or application failures
- Minimizes downtime with automated remediation capabilities
- Simulates end-user experience for web and other applications
- Uses standard SNMP and WMI protocols for agentless monitoring of applications and systems and REST API for VMware monitoring
- Includes an embedded web server and database, designed for a simple, integrated installation experience without the hassle or expense of installing separate components
Features Overview
Quick, affordable, and agentless IT monitoring for your network, servers, VMware hosts and applications.

Powerful visibility
Know when and where critical issues are happening, before end-users, with a simple interface and easy alerting.

Quick
Start monitoring typically in minutes, and enjoy a snappy interface that will help you identify potential or current issues—fast.

Lightweight footprint
Runs on one machine with minimal system requirements. Flat file storage means no separate database to maintain.

Affordable
Monitor-based licensing gets you just what you need for just the right price.

Agentless monitoring
Provides agentless architecture as a backbone for a comprehensive feature set.
Features:
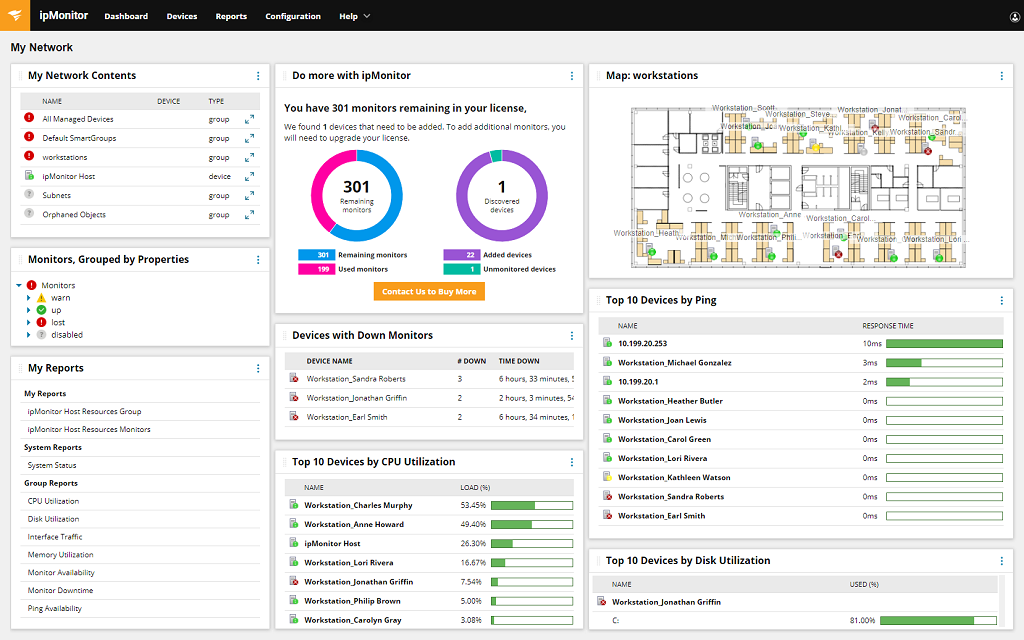
Easy-to-Use Web Interface With Centralized Dashboard Views
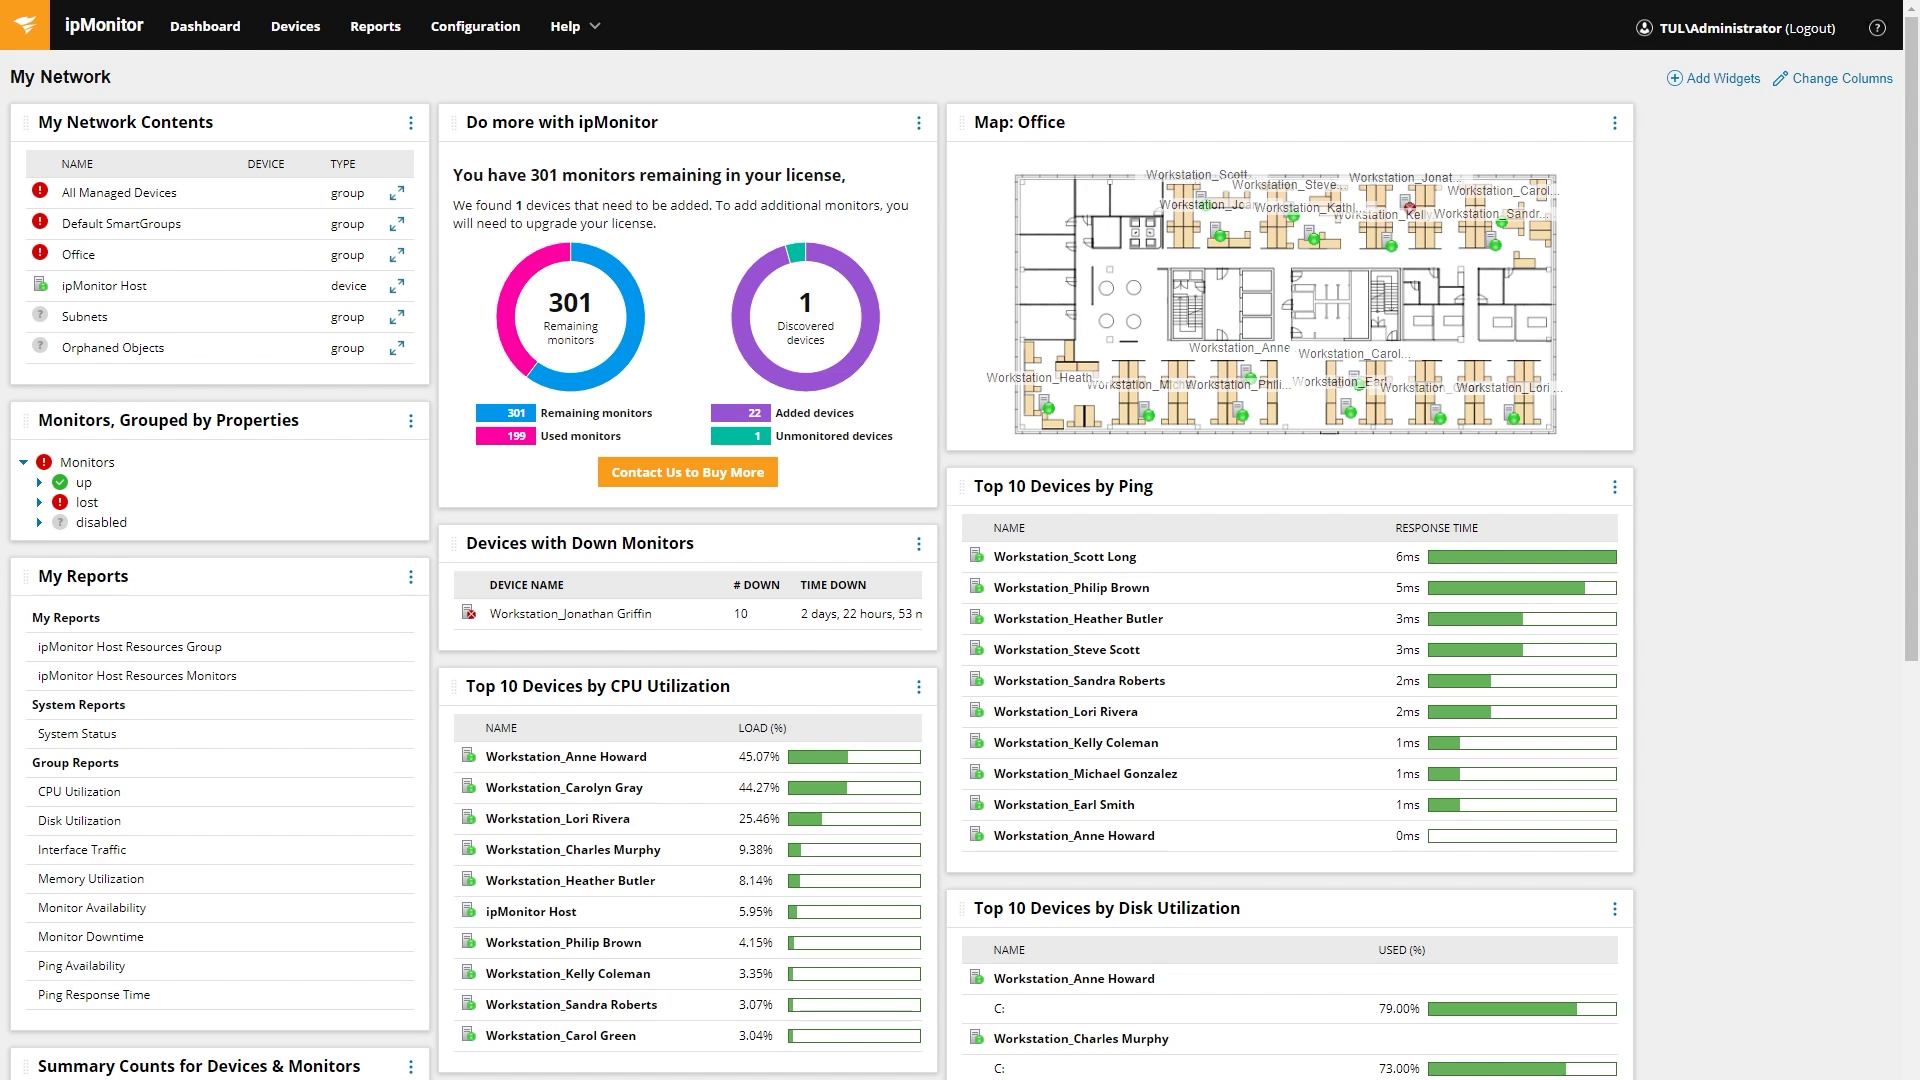
The ipMonitor web-based interface offers centralized, customizable summary views that can provide visibility into the health of your IT infrastructure. With support for drag and drop, it’s designed to make it easy to add and remove elements from the view to help ensure you have the reports, statistics, and gauges you need—right at your fingertips. ipMonitor dashboards also make it easy to identify problem areas at a glance so that you can resolve the issue quickly.
Built-In Reporting WSith NOC Dashboard
ipMonitor is intended to deliver a full-screen NOC view that will knock your socks
off, providing easy-to-view status reports with drill-down into groups and monitors
in your environment. Additionally, from the ipMonitor reporting interface, point and
shoot zoomable reports can give you the ability to view data for a specific time
period or event—a feature that is particularly useful when you are trying to troubleshoot issues and identify the root cause of failures.
Lightweight Installation
ipMonitor includes a fully integrated database and web server, helping eliminate
additional costs that can be inherited through a dependency on third-party databases or web servers. ipMonitor is designed to be a self-reliant monitoring solution
that preserves the integrity of your data, and makes sure that you are the first to be
alerted of service interruption, before it affects your end users.
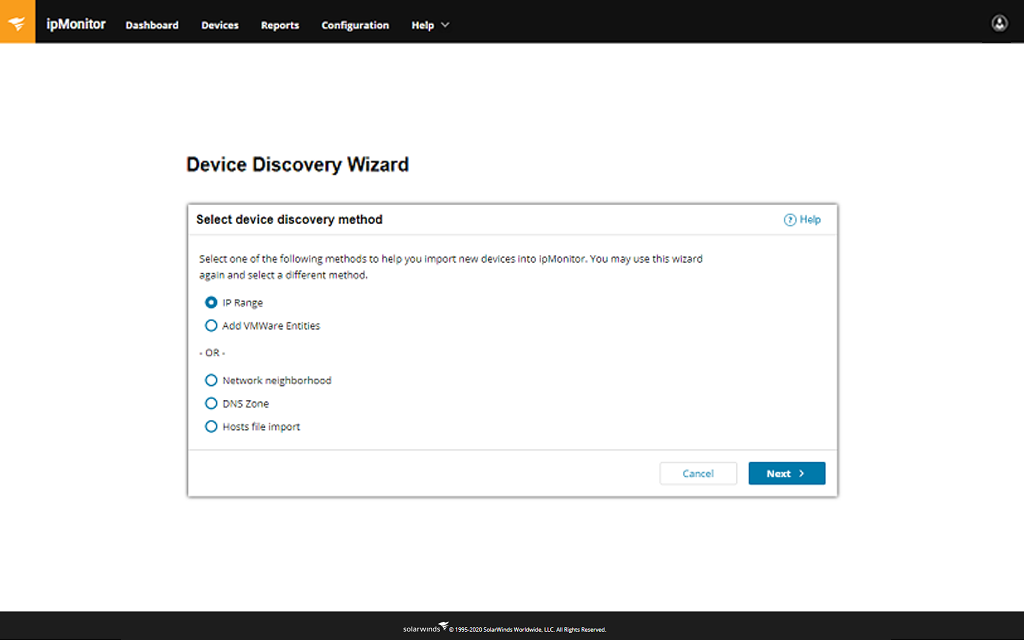
Wizard-Driven Setup and Express Device Discovery
It’s hard to believe, but true. ipMonitor can be installed and operational typically in minutes, with a slick Startup Wizard designed to guide you through the automated
discovery and alert con¬figuration process, so you don’t have to lift a finger. IpMonitor
Discovery Wizard is intended to provide a multitude of scanning methods, including IP
address range, DNS zone, host import, network neighborhood, and the ability to add
your VMware hosts. The Discovery Wizard is designed to enable faster network scanning and discovery, and returns detailed network data including device classifications and layer-3 topology information. ipMonitor can make starting automatic, fast, and easy
Out-of-the-Box SmartMonitor Recommended Settings
The ipMonitor solution’s unique SmartMonitor technology suggests optimal monitors
and data collection settings for almost everything on your network—which can
save you time and help reduce the need for you to navigate the murky waters of
configuring settings by hand. SmartMonitor technology leverages the collective
experience of our SolarWinds engineers to help ensure that you receive network
coverage quickly, and with the most advantageous network monitoring settings.
Dynamic Network Mapping
ipMonitor can auto-discover network devices and create rich network maps that
can be customized to show the connection between elements or to add nested
elements. Maps help to enable you to visually monitor network health with dynamically managed status indicators that offer drill-down capabilities for quicker
problem resolution.
Enhanced Device Grouping for Easy Management
ipMonitor helps to make it painless to manage lists of devices and their logical
organization with enhanced grouping and nested grouping capabilities. Plus, SmartGroups is designed to allow dynamic grouping of devices and monitors based on
user-defined filters. A centralized view of device and monitor groups is displayed in
an Explorer-style tree format that offers one-click navigation to the properties and
settings for that element, helping to make it easier and faster to manage groups
of devices.
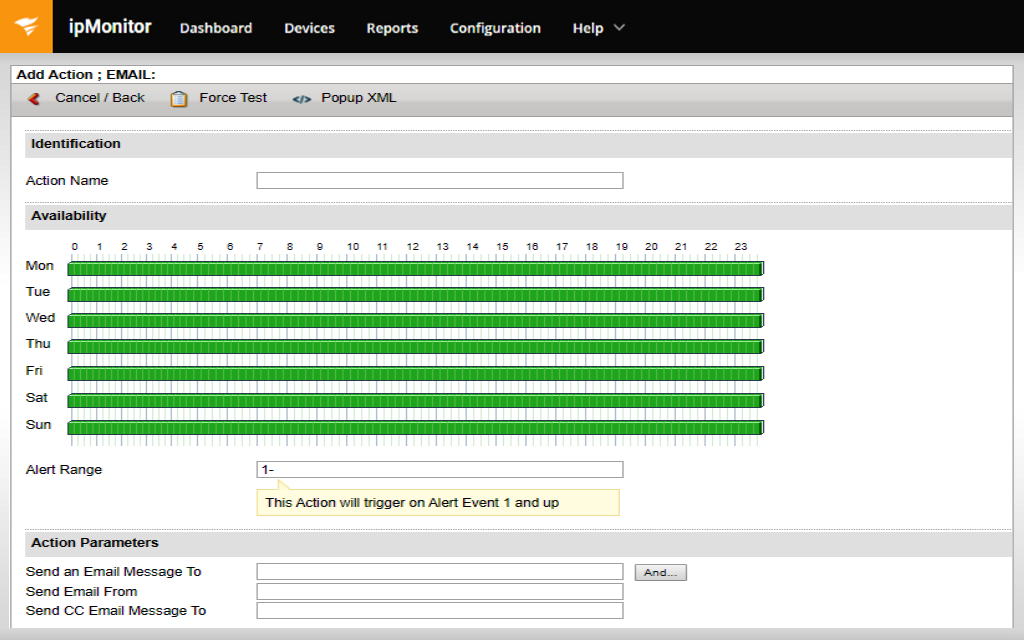
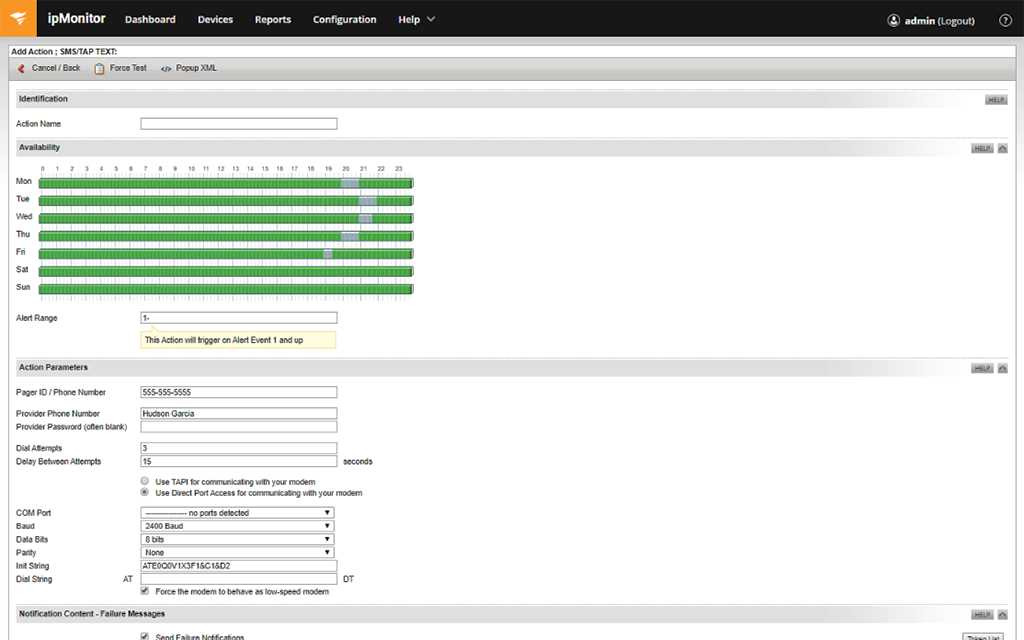
Automatic Alerting
ipMonitor offers more than 14 different types of notifications to help ensure that you
are the first to know about network issues or application failures. Alerts can be as
simple as receiving an email or text message on your cell phone, or as comprehensive
as writing to Windows®
Event Log files.
Automatic Recovery
ipMonitor can be easily configured to take corrective actions to restore services if a
failure occurs, including restarting failed applications, restarting Windows services,
rebooting servers, and executing scripts. ipMonitor helps minimize downtime by
automating remediation steps.
True Remote Administration
SolarWinds ipMonitor is designed to be a safe web-based interface that allows
users to scan their network, configure monitors, or take corrective action from any
supported browser. You can monitor your infrastructure from virtually anywhere
with an internet connection—freeing you from the office.
User Experience Monitoring
ipMonitor can show your users the love—even the high maintenance ones. Going
beyond basic availability checking, ipMonitor is designed to give you complete visibility into the quality of an end-user’s experience. In fact, ipMonitor can mimic a user’s behavior by performing synthetic transactions. You’ll be alerted to issues
before your users notice a blip in the availability of business-critical applications,
like email, web, or database services.
Screenshots:
Discover critical IT devices, and monitor their availability, responsiveness, and performance.
Our Startup Wizard guides you through an automated discovery and alert configuration process, offering out-of-the-box recommendations for what to monitor on each device and application.
Be the first to know about network issues and application failures. Escalate alerts to other IT staff.
Over a dozen notification types help ensure you will know about network issues or application failures. Receive alerts via email or text message, or even right to Windows Event Log files.
Pinpoint performance issues on network maps and NOC view, and drill down for problem resolution.
Quickly see what devices, servers or applications are experiencing availability or performance issues, and drill down to get specific metrics associated with the problem.
Restart failed applications and Windows services, reboot servers, back up files, and run scripts.
Avoid late night calls and resolve issues without your intervention by automating corrective actions to restore services if a failure occurs.
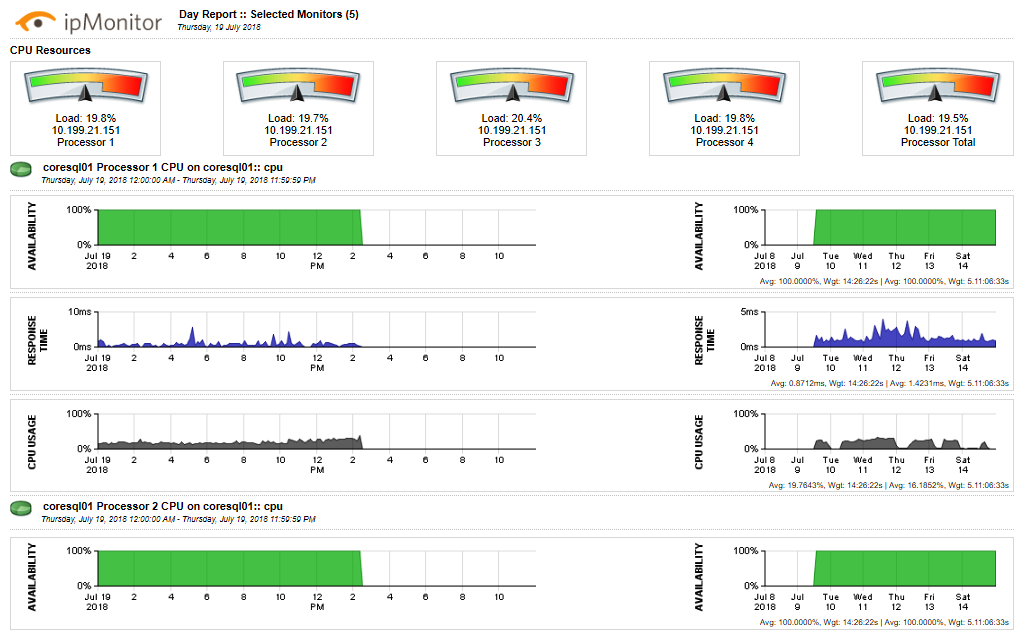
Monitor historical performance data on customizable reports, and schedule delivery via email.
Point-and-shoot zoomable reports give you the ability to view data for a specific time period or event—particularly useful to identify the root cause of failures.
System Requirements:
| Hardware | Minimum Requirements |
|---|---|
| CPU | Single core 2.0GHz |
| Memory | 512MB |
| Hard Drive | 240MB Free |
| Software | Minimum Requirements |
| Operating System | Windows 8, Windows 2012 (.net Framework 3.5 required), Windows 10, Server 2012R2, and Server 2016 |
| Web Browser | ipMonitor supports the two most recent versions of the following web browsers available at the release date: Mozilla, Firefox, Google Chrome™, Microsoft Edge, Apple Safari. |
Documentation:
Download the Solarwinds ipMonitor Datasheet (.PDF)
Get in touch with a Solarwinds Solutions Specialist today to Learn More!

