
Solarwinds Log Analyzer
Turn your log data into a powerful investigation and troubleshooting tool
Overview:
Easily investigate machine data to help identify the root cause of IT issues faster
SolarWinds® Log Analyzer is a powerful log management and analysis tool designed to fully integrate with the Orion® Platform and provide users with a mechanism to realize the potential of their log data. With real-time log collection, analysis, and visualization, you can gain out-of-the-box visibility into the performance and availability of your IT infrastructure and applications.
Using logs to troubleshoot doesn’t have to be so hard.
Do you find yourself asking…
What is happening on devices right now?
Perform near real-time troubleshooting with near real-time log streaming from any device in your network.
How can I see when there was a spike in activity?
Quickly identify hot spots of activity across your environment.
Why did we get the blue screen of death?
Better understand what was happening on your Windows devices before they became unavailable.
Log Analyzer at a Glance
- Collect log data generated by your infrastructure and Windows® applications to help you gain deeper insight when troubleshooting and performing forensic analysis of IT issues
- Refine your log data via intuitive out-of-the box filters, and help you find relevant log entries instantly via a powerful search engine
- Quickly visualize log volume, search results, and refine timeframes via an interactive chart
- Take action on critical events through the integrated Orion alerts
- Integrate your log data directly into the Orion Platform console to easily view it alongside network and systems performance metrics
Features Overview
See how SolarWinds can provide quick insight into system behavior

Unexpected simplicity
Powerfully designed and intuitive log aggregation, tagging, filtering, and alerting for effective troubleshooting.

See it all in one tool
Fully integrated with Orion Platform products, enabling a unified view of IT infrastructure monitoring and associated logs.

Built by IT pros, with IT pros
Solarwinds has worked as network and systems engineers, so they understand your problems and how to solve them.
Features:
Event log collection and analysis
Your infrastructure and applications are constantly generating log data to provide
performance insight. Whether they’re syslog, SNMP traps, Windows, or VMware®
events, they often can provide crucial bits of insight to help with troubleshooting.
Collect, consolidate, and analyze log information with one tool to help you find the
root cause faster.
Search and filter log data
Log data piles up fast, and it can be tricky to find the right bit of information. Log
Analyzer helps you quickly perform searches and apply filters to refine your results.
In addition, easily apply color-coded tags to your log data to aid with filtering,
searching, and identifying performance issues.
Real-time log stream
Traditional log collection and management tools generate reports in plain text or
HTML. With SolarWinds Log Analyzer, you can also see an interactive, real-time log
stream. Ease troubleshooting by watching the log data to identify potential issues
as they occur, and filter for keywords like event IDs or error codes.
Orion intelligent alert actions
Be the first to know when issues arise. Log Analyzer integrates with the Orion
Platform’s intelligent alert engine to provide customizable alerts and delivery
options, including email notifications, ServiceNow® and SolarWinds Service Desk
integration, and the ability to trigger an external script.
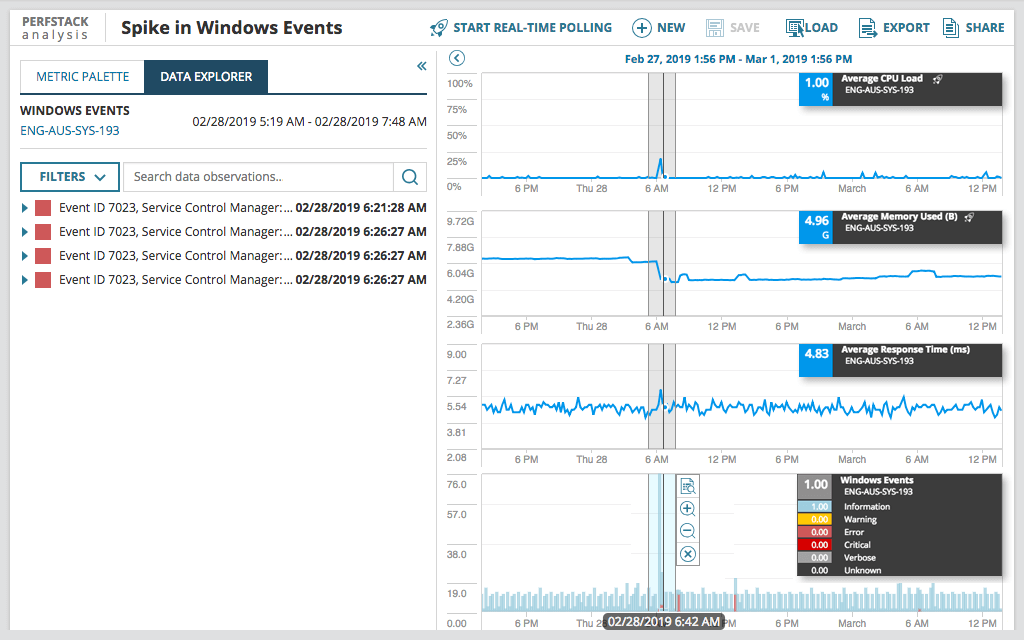
Correlate log data with performance metrics
With SolarWinds PerfStack™, you can see log data on a common timeline with
network and systems availability and performance metrics, providing an easy and
quick way to visualize what events may have led up to an outage or slowdown.
Log Analyzer is a part of the SolarWinds Orion® Platform.
Change the way you think about IT. SolarWinds delivers central visibility and control through a tightly integrated experience.
One vendor. One platform. One single pane of glass.
- Easily view log data alongside network and systems performance to speed full-context troubleshooting with full integration of log and event data in the Orion® Platform console.
- Use the Orion Platform intelligent alert engine to build customizable alerts in a single pane of glass, define notification criteria, trigger external scripts, and integrate with help desk ticketing systems.
- Collect, consolidate, and analyze network, systems, Windows®, and VMware® events alongside availability and performance data from the following SolarWinds® solutions: Network Performance Monitor (NPM), NetFlow Traffic Analyzer (NTA), Server & Application Monitor (SAM), and Virtualization Manager (VMAN).
Screenshots:
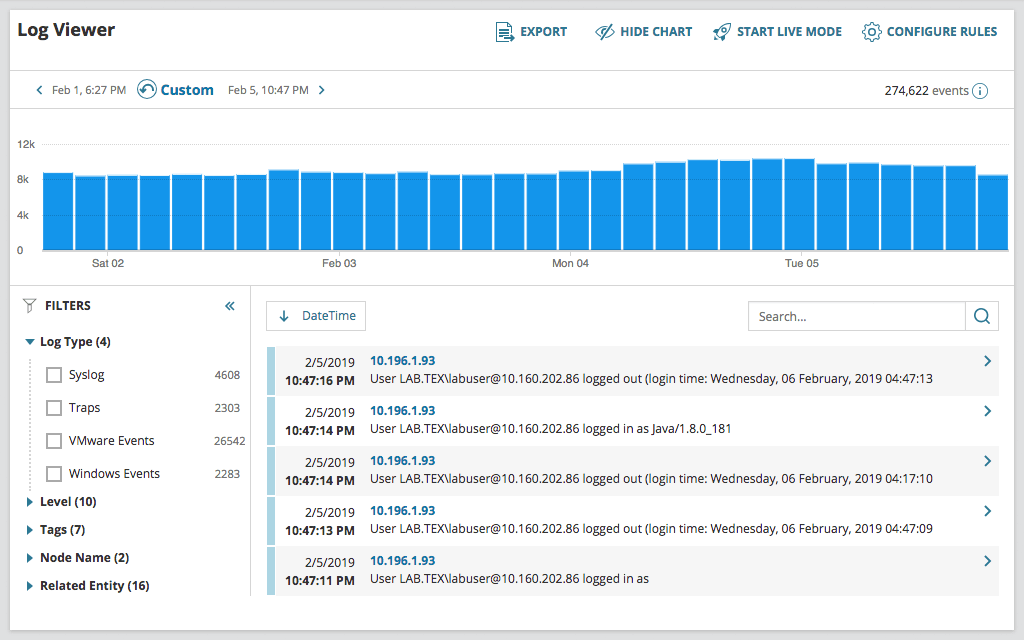
Gain insight into the performance of your environment.
Your infrastructure is constantly generating log data to provide performance insight. Collect, consolidate, and analyze thousands of syslog, traps, Windows, and VMware events to perform root-cause analysis with log monitoring tools from Log Analyzer.
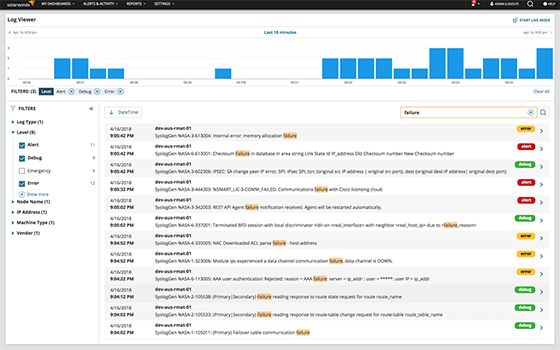
Rapid identification of performance and availability issues.
Perform searches using basic matching. Execute searches using multiple search criteria and apply filters to narrow results. Save, schedule, and export search results within the log monitoring software.
.png)
See log data in real-time with an interactive chart and graph.
Traditional log collection and log management tools generate reports in plain text or HTML. SolarWinds® Log Analyzer displays logs in an interactive, real-time log stream.
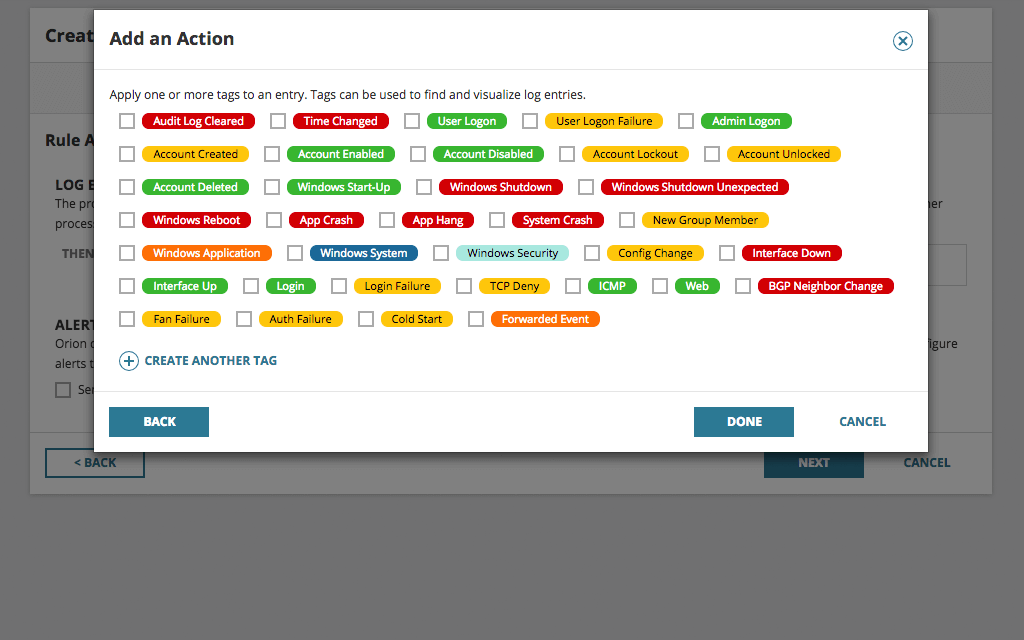
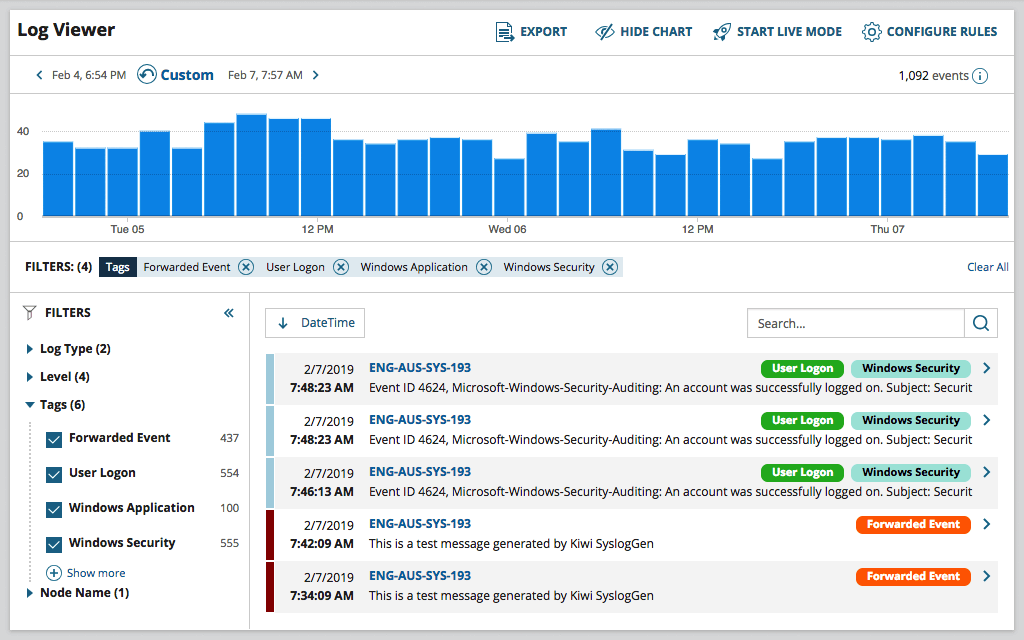
Simplified log search
Easily apply (color-coded) tags to your log data to aid with filtering, searching, and identifying performance issues.
Collect, analyze, and alert on data in Windows flat log files
Log Analyzer can collect Windows flat log files and provide insight to help admins troubleshoot and resolve application issues faster.
Unified infrastructure monitoring and centralized event log management.
SolarWinds Log Analyzer directly integrates your log and event data into the Orion Platform console so you can easily view log data alongside network and systems performance.
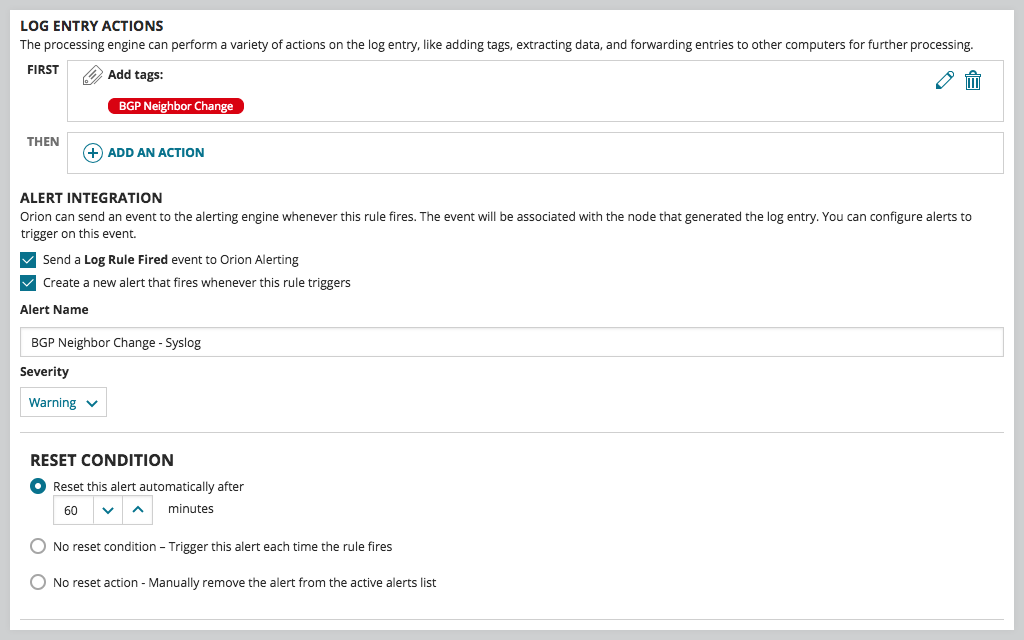
Leverage Orion intelligent alert actions
Be the first to know when issues arise. Log Analyzer integrates with the intelligent alert engine of Orion to provide customizable alerts along with delivery options including email notification, ServiceNow integration, and the triggering of an external script.
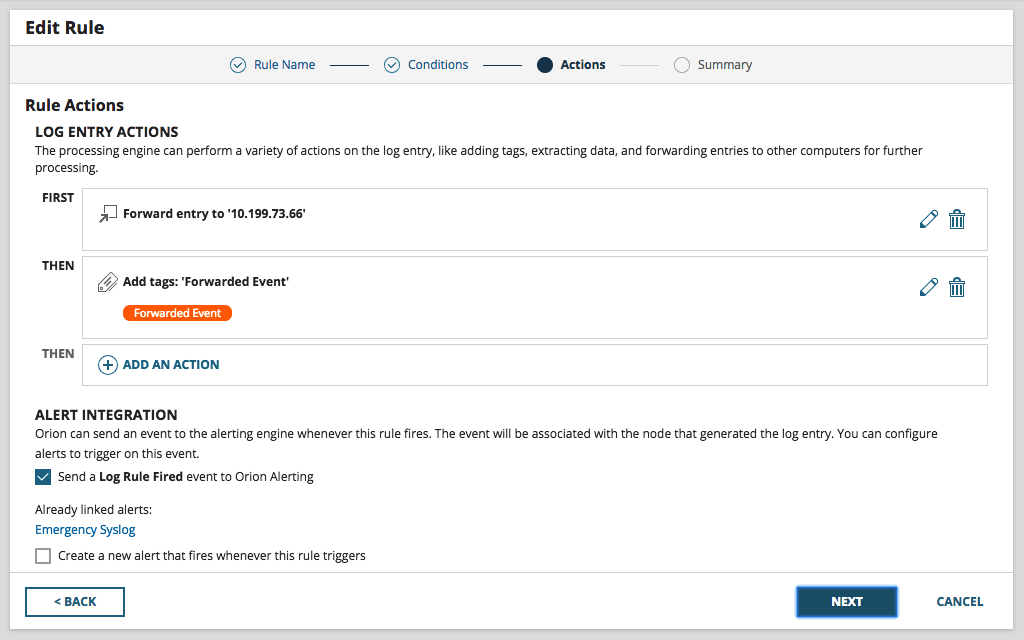
Keep your log aggregator from being a dead end
Having your log data in a central location is great for troubleshooting and correlation, but what if you need that useful data in other locations or tools? Log Analyzer allows you to forward logs to other applications, such as ticketing systems or SIEMs, and export log data to CSV files for even more flexibility.
System Requirements:
| TYPE | REQUIREMENTS |
|---|---|
| LA Database | Physical server or virtual machine Quad core processor or better 16GB RAM 1 x 1 Gb dedicated NIC Windows Server 2016 or 2019, Standard or Datacenter Edition Disk requirements: 100 – 130GB/day (@1000 EPS) on local NTFS disk Microsoft® SQL Server® 2016 SP1 or later Supported collations: English with collation setting SQL_Latin1_General_CP1_CI_AS English with collation setting SQL_Latin1_General_CP1_CS_AS |
| LA/Orion Server | Quad core processor or better Required: 4 cores Recommended: 8 cores HDD: 15GB minimum, 40GB recommended Memory 8GB minimum 16GB recommended |
| SOFTWARE | MINIMUM REQUIREMENTS |
| Operating System | Windows Server® 2016, 2019 |
| Operating System Language | English (U.K. or U.S.) |
NOTE: The minimum server requirements listed assume default configuration. Significantly increasing the poll rate or statistic collection rate could result in additional load on the server, which may require a larger CPU or additional memory.
How is Log Analyzer licensed?
Straightforward licensing
No need for complex volume calculations; the SolarWinds Log Analyzer software’s licensing is based on the number of devices generating log data, regardless of volume.
What are the supported log sources for Log Analyzer?
Consolidate logs from multiple sources
SolarWinds Log Analyzer currently supports syslog, SNMP traps, Windows flat log files, Windows events, and VMware events.
Where is my log data stored? How long is it stored for?
Keep your data as long as you want
Data is stored in the SolarWinds Log Analyzer SQL database for seven days by default; however, this can be easily configured within the product settings.
What happens if I evaluate Log Analyzer and it isn’t a good fit?
At evaluation end, Log Analyzer will revert to Orion® Log Viewer.
When your evaluation copy of Log Analyzer expires, it will revert to Orion Log Viewer for continued basic log monitoring capabilities.
What if Log Analyzer doesn’t meet my needs?
If you’ve got logs, we’ve got a log monitoring tool
Whether you are in IT ops, infrastructure, monitoring, or DevOps, SolarWinds has the right log monitoring and management tool for you.
Documentation:
Download the Solarwinds Log Analyzer Datasheet (.PDF)
Get in touch with a Solarwinds Solutions Specialist today to Learn More!