
Solarwinds Log and Systems Performance Pack
Systems and server performance and log monitoring in a single unified console
Server & Application Monitor
.png)
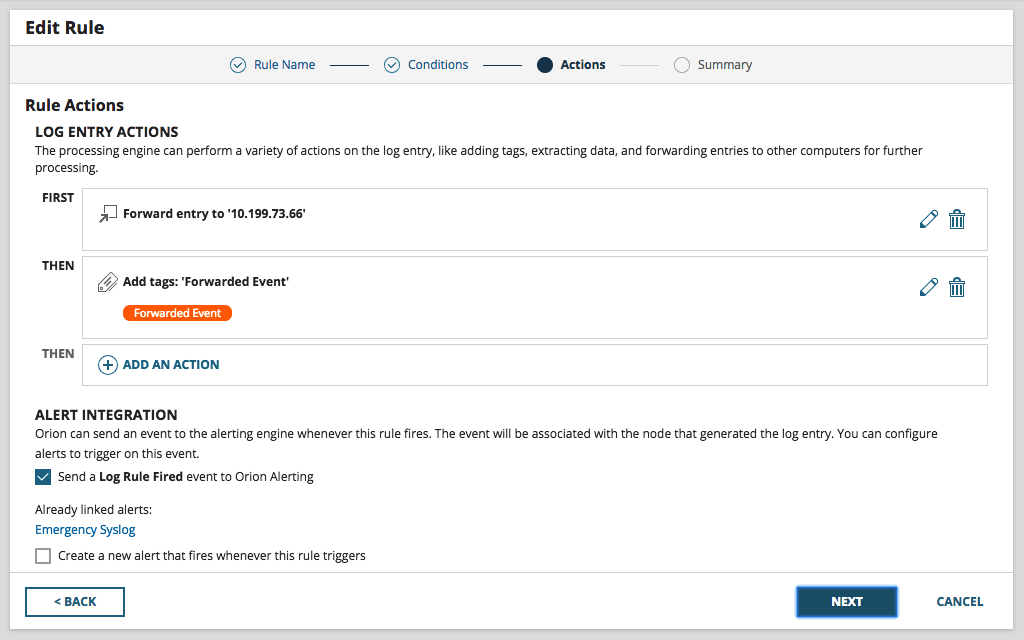
Log Analyzer
Overview:
Why Bundle?
- Monitor any application, any server, anywhere
Monitor the performance, capacity, and health of Linux and Windows apps and servers across data centers, remote offices, and the cloud. - Aggregate, search, and chart log data
Collect, consolidate, and analyze thousands of syslog, traps, and Windows events to perform root cause analysis. - Accelerate time to resolution
View log data and systems performance side-by-side with seamless Orion Platform integration.
What Does The Log and Systems Performance Pack Including?
Server & Application Monitor
Comprehensive server and application monitoring made simple
- Get started typically in minutes
- Monitor Azure and AWS IaaS, PaaS, and SaaS
- 1,200+ out-of-the-box monitoring templates, plus more than 1,000 community templates
- Custom monitoring with REST API, WMI, SNMP, and PowerShell scripts
- Customizable server monitoring
- Infrastructure dependency mapping
Log Analyzer
Easily investigate machine data to help identify the root cause of IT issues faster
- Log and event collection and analysis
- Powerful search and filter
- Real-time log stream
- Event log tagging
- Flat log file ingestion
- Orion Platform integration
What's Included:
| Server & Application Monitor | Log Analyzer | Log and Systems Performance Pack | |
|---|---|---|---|
| Includes: SAM, Log Analyzer | |||
| Monitor the performance, capacity, and health of Linux and Windows apps across data centers, remote offices, and the cloud | |||
| Quickly monitor the performance and availability of Microsoft Azure and Amazon AWS infrastructure | |||
| Application performance monitoring for 1200+ applications and systems | |||
| Quickly pinpoint the root cause of application issues within physical and virtual server environments | |||
| Monitor the health and availability of virtual hosts and guests alongside physical servers | |||
| Monitor server storage volumes, disk usage, and capacity metrics out of the box | |||
| Reduce the flood of useless alerts with a customizable alerting engine | |||
| Collect, consolidate, and analyze thousands of syslog and traps to perform root cause analysis | |||
| See log data in real-time with an interactive chart and graph | |||
| Execute searches using multiple search criteria and apply filters to narrow results | |||
| Tag log data to aid with filtering, searching, and identifying performance issues |
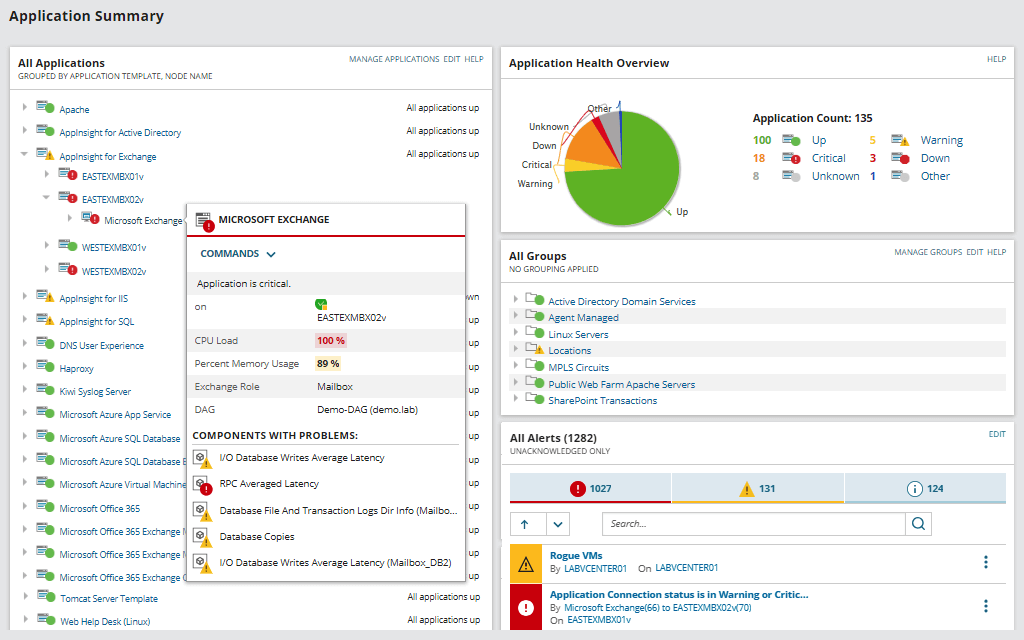
Server & Application Monitor:
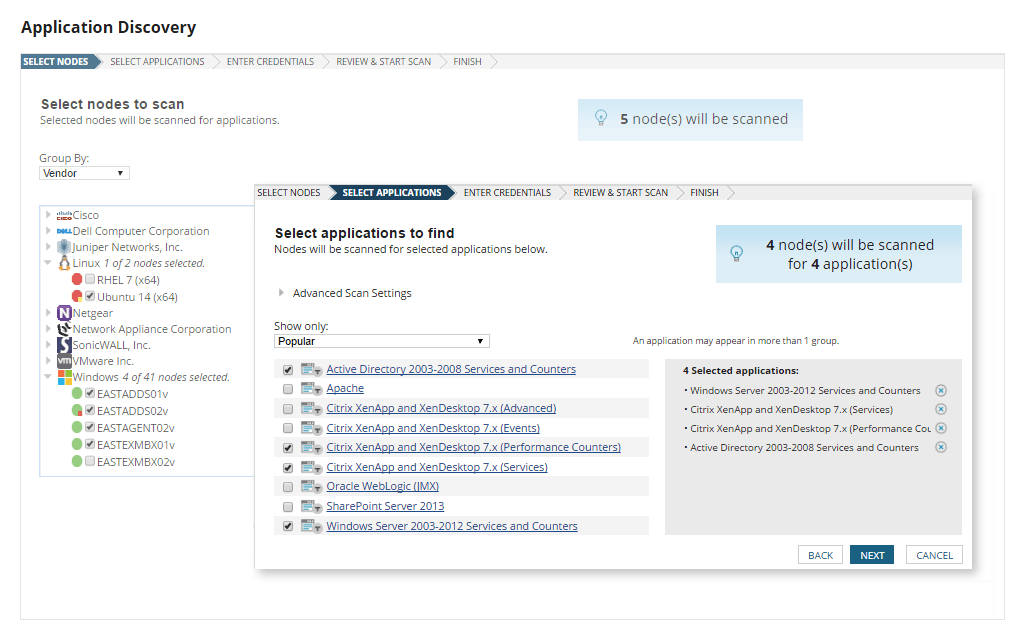
Automatic application discovery and server monitoring.
Download, install, automatically discover your environment, and start monitoring in about an hour with help from SAM's simple server monitoring tool. No professional services required.
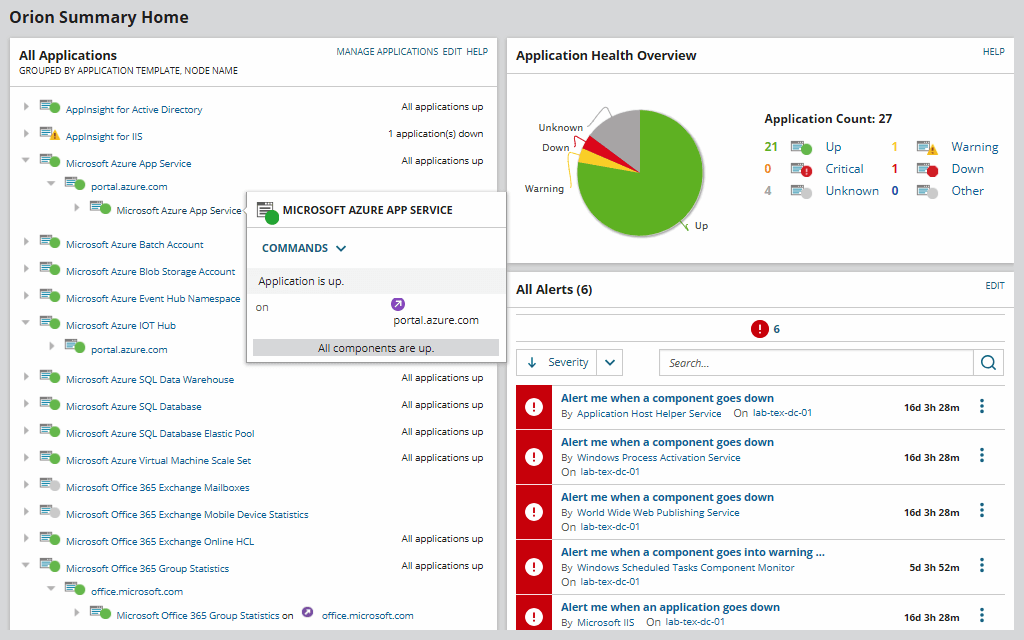
Quickly monitor the performance and availability of Microsoft Azure and Amazon AWS services.
Monitor the IaaS, PaaS, and SaaS services for Amazon Web Serices (AWS) and Microsoft Azure. Provide end-to-end systems performance and application monitoring using agent and agentless-based technologies for application, systems, and service metrics.
Built-in templates provide best practices.
Systems and application performance monitoring and troubleshooting templates for 1,200+ supported applications, systems, and infrastructure such as:
- Get more in-depth application monitoring with AppInsight™ dashboards for Active Directory, Exchange, Microsoft IIS, and SQL Server.
- View code-level application performance level detail with Application Performance Monitor integration.
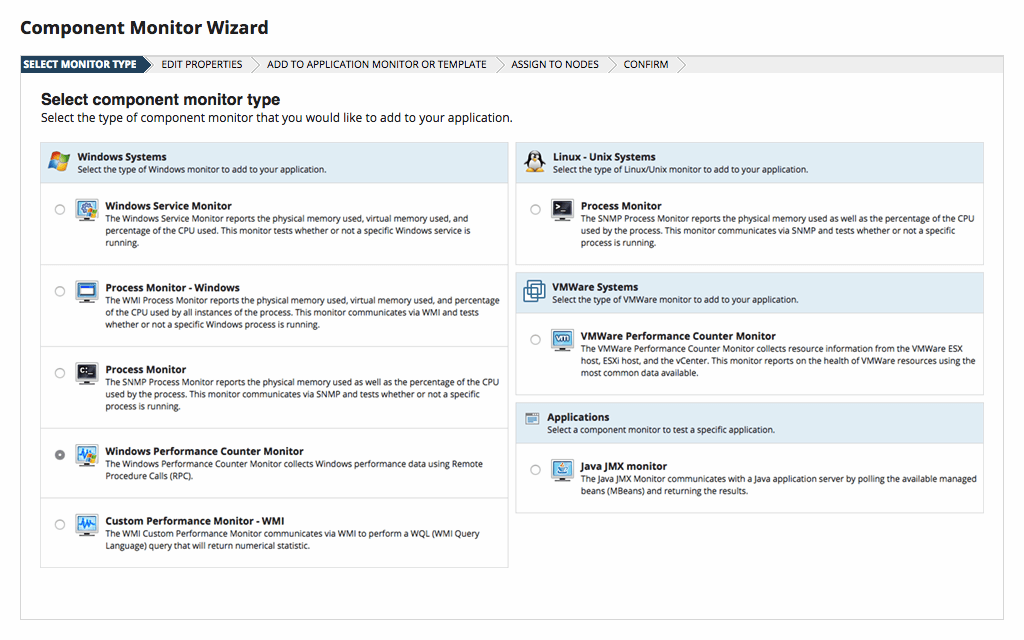
Extensive customization gives you the power to monitor what and how you want.
Create custom monitors, modify built-in templates, and import your existing custom scripts in just a few clicks. We know that every IT environment is different, which is why SAM server monitoring is designed to allow you to monitor any service, process, or application, regardless of whether it’s a commercial or a custom application.
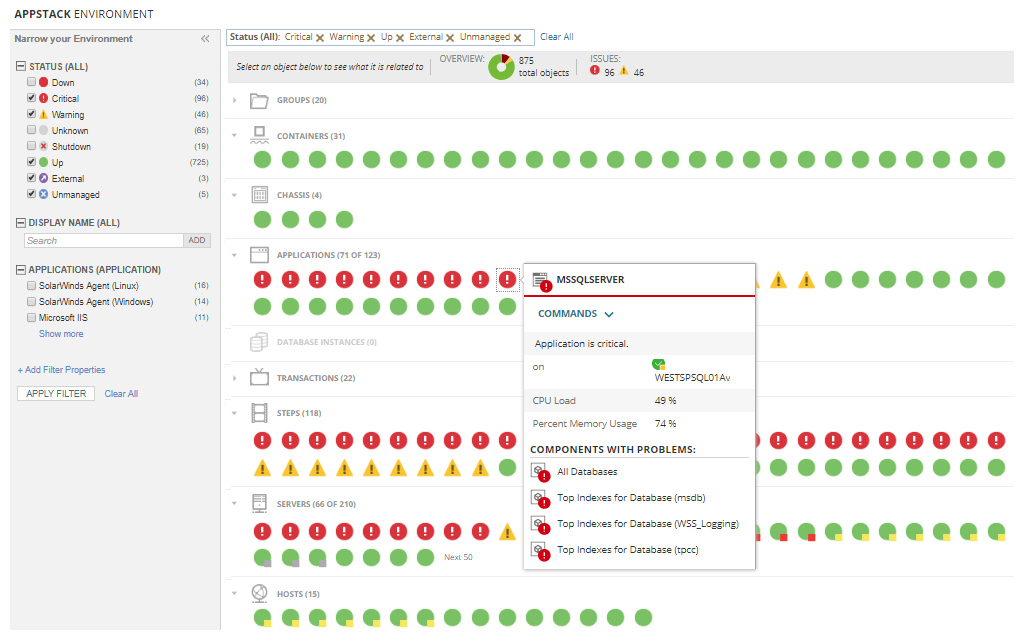
Dynamic app-centric infrastructure dependency mapping.
With the AppStack™ dashboard, you can quickly see infrastructure dependencies and pinpoint the root cause of application issues within physical and virtual server environments. Identify where application issues originate typically in just a few seconds.
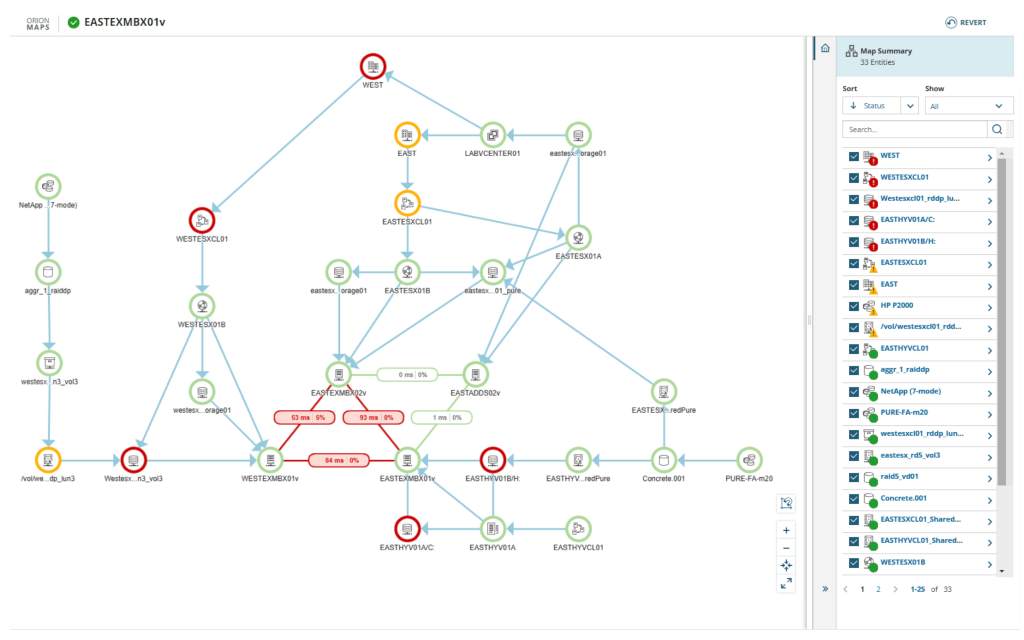
Automatically discover network-based relationships.
Automatically discover and visualize network-based relationships between applications and servers. Examine and monitor inbound and outbound network connections and analyze metrics, including latency and packet loss. Visualize individual application or server connections, or view a complete map of application dependencies of multiple application, servers, and infrastructure connections to determine if network communication issues are affecting business-critical applications.
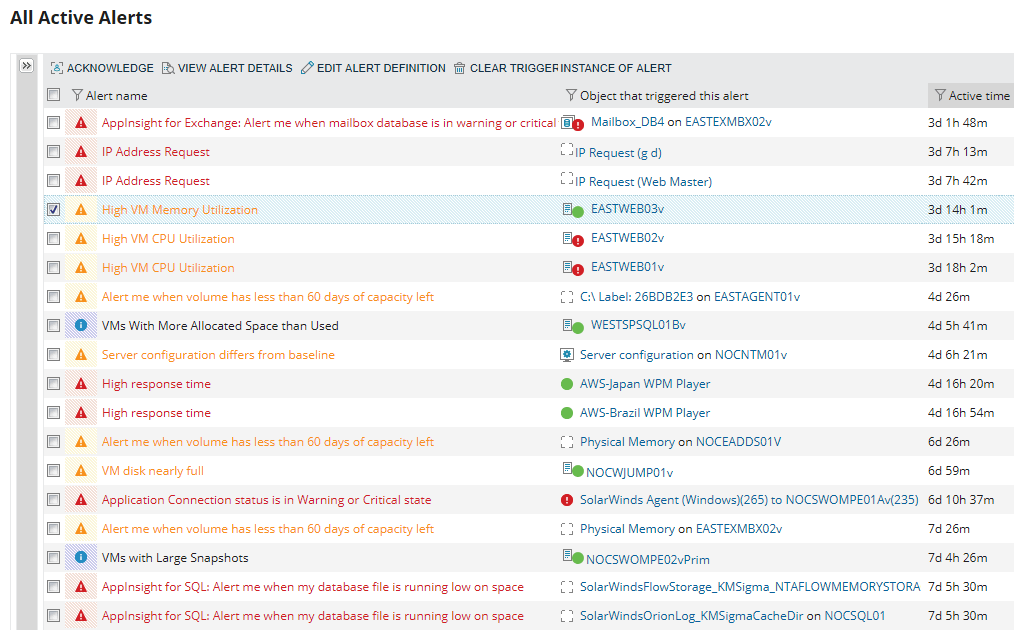
Pre-packaged and customizable alerts and reports.
Reduce alert fatigue with custom alert thresholds, or use the dynamic baselines feature to set alert thresholds and define “what’s normal”. Create server monitoring alerts based on simple or complex nested trigger conditions, defined parent/child dependencies, and more. Use one of the hundreds of built-in reports, or create your own using the web-based interface to fit your business needs.
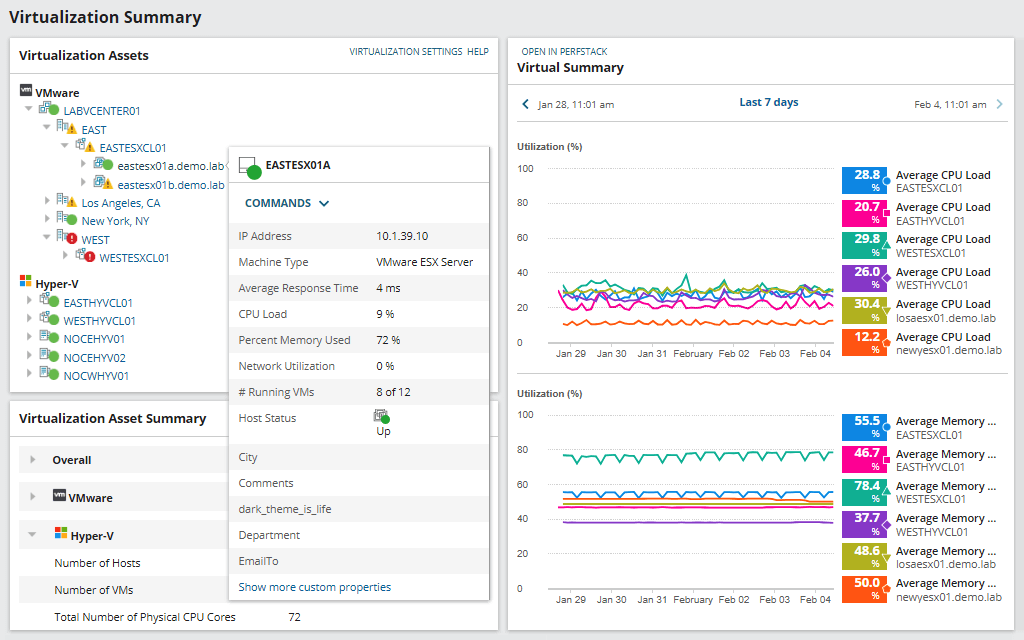
Microsoft Hyper-V and VMware ESX health and performance metrics.
Monitor the health and availability of virtual hosts and guests alongside physical servers. Integration with SolarWinds® Virtualization Manager provides deeper insight to troubleshoot virtualization issues.
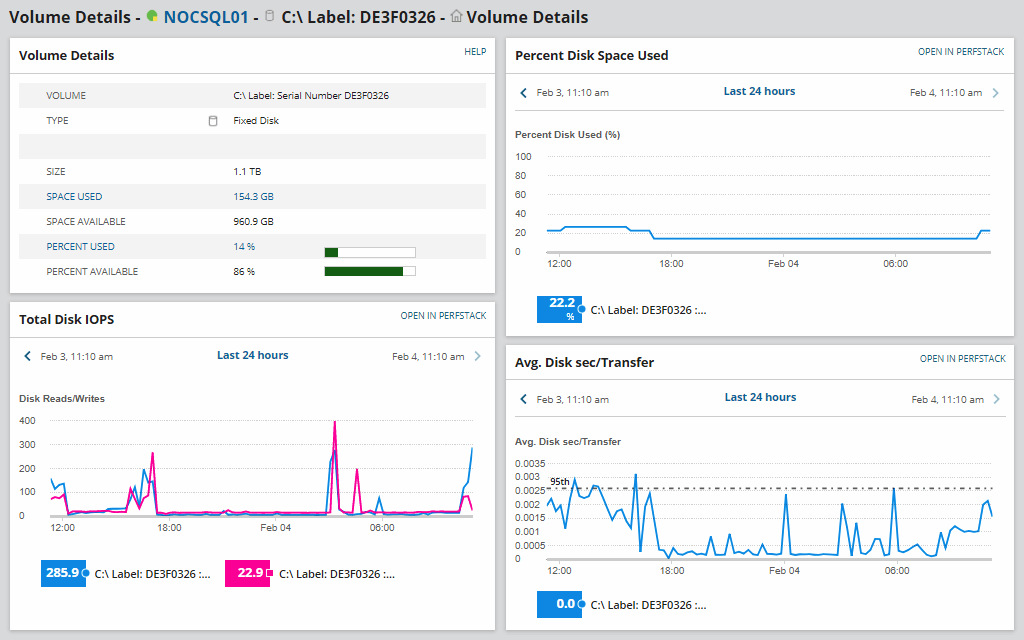
Server volume monitoring and capacity planning.
Monitor server storage volumes, disk usage, and capacity metrics out of the box. Integration with SolarWinds Storage Resource Monitor provides deeper insight to troubleshoot storage issues in SAN and NAS environments.
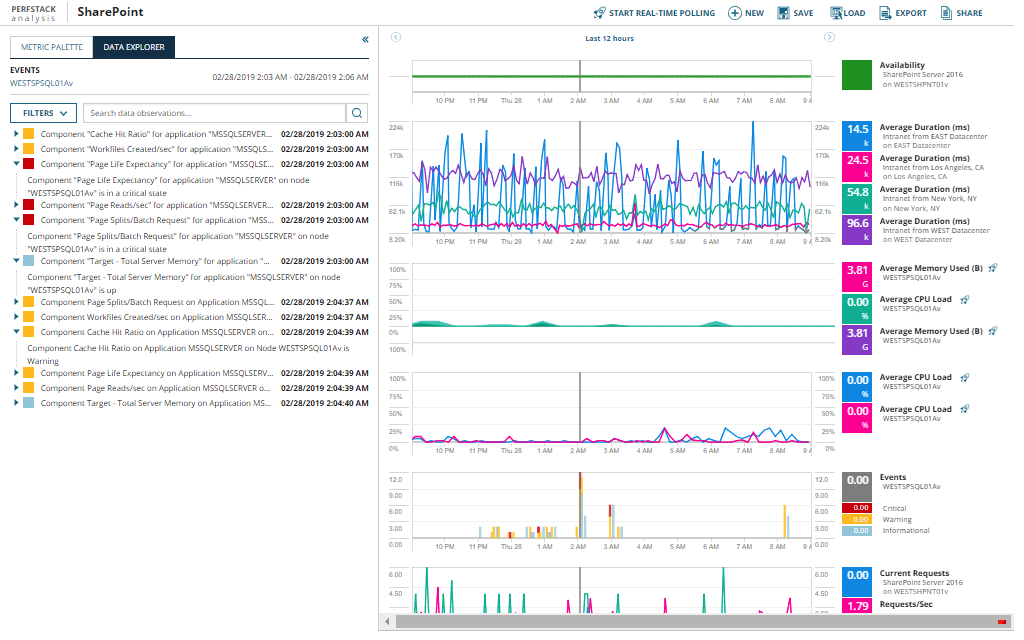
Cross-stack IT data correlation.
The PerfStack™ dashboard included with SAM server monitoring software can enable you to drag, drop, and overlay performance metrics from your systems data and multiple sources (such as network, virtualization, or storage), and view data types on a single chart.
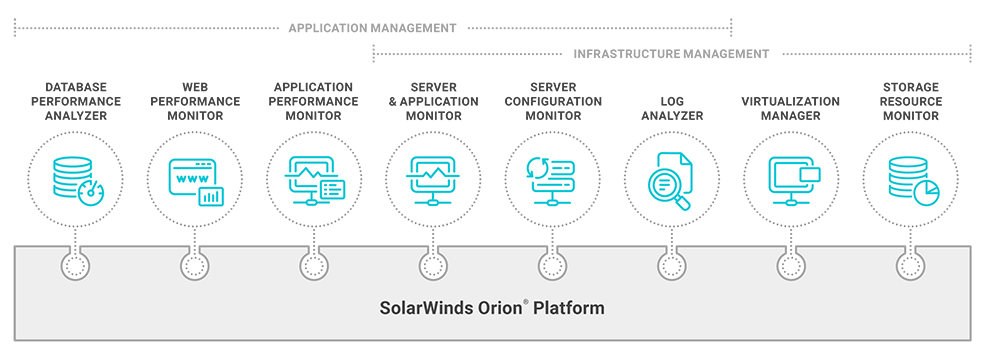
Powered by the scalable and extensible SolarWinds Orion Platform.
Integrates with other Orion Platform-powered products for unified server monitoring and deeper insight into web performance, storage, network, database, and virtualized resources. Reduce false p<bositives with intelligent baseline alerting. The Orion Platform can also allow you to easily customize built-in alerts and reports as needed.
Log Analyzer:
Gain insight into the performance of your environment.
Your infrastructure is constantly generating log data to provide performance insight. Collect, consolidate, and analyze thousands of syslog, traps, Windows, and VMware events to perform root-cause analysis with log monitoring tools from Log Analyzer.
Rapid identification of performance and availability issues.
Perform searches using basic matching. Execute searches using multiple search criteria and apply filters to narrow results. Save, schedule, and export search results within the log monitoring software.
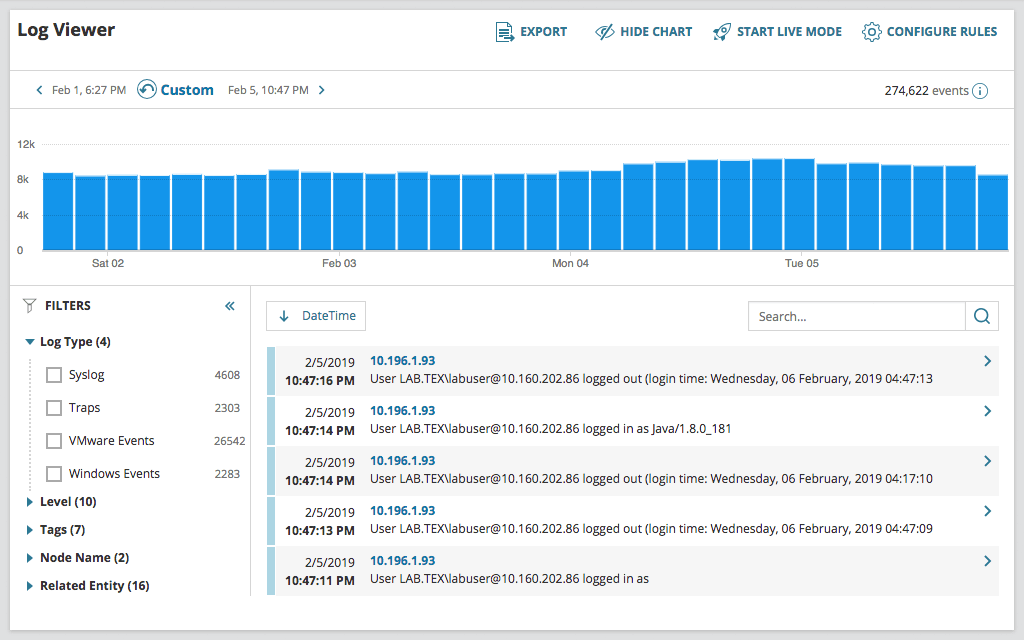
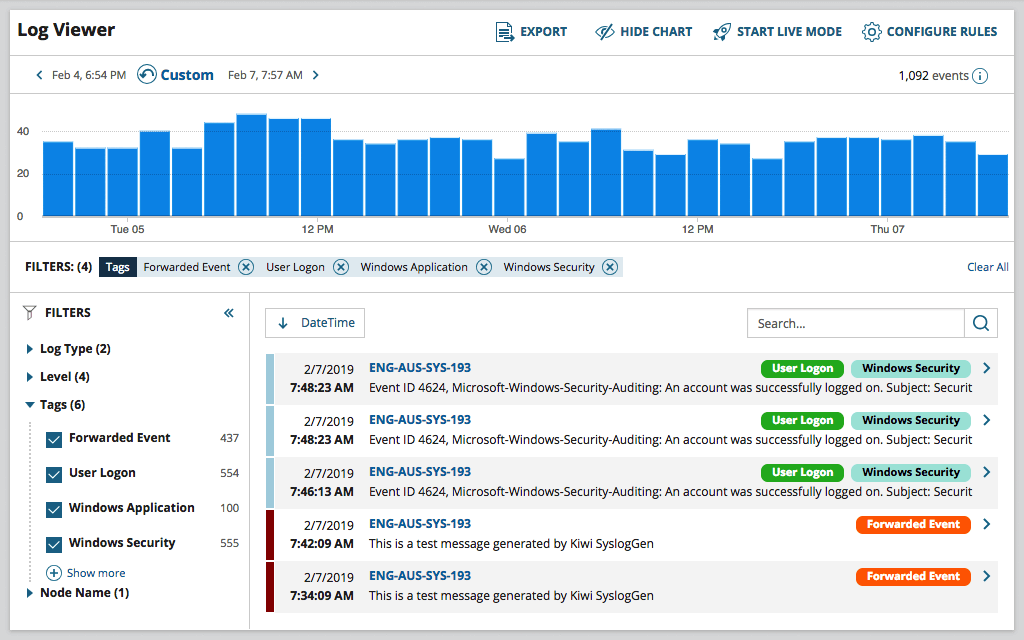
See log data in real-time with an interactive chart and graph.
Traditional log collection and log management tools generate reports in plain text or HTML. SolarWinds® Log Analyzer displays logs in an interactive, real-time log stream.
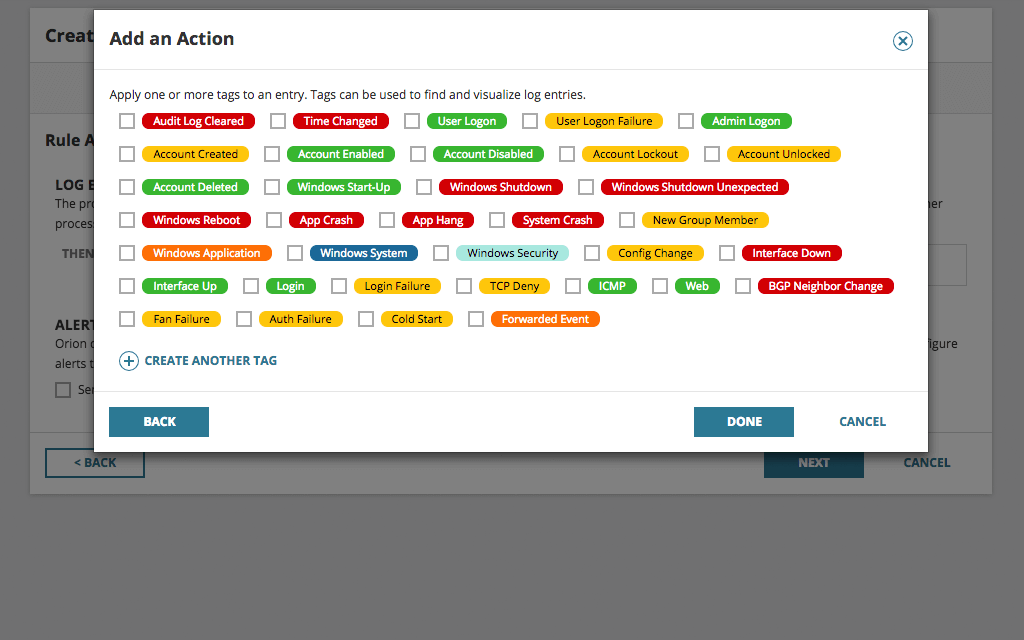
Simplified log search
Easily apply (color-coded) tags to your log data to aid with filtering, searching, and identifying performance issues.
Collect, analyze, and alert on data in Windows flat log files
Log Analyzer can collect Windows flat log files and provide insight to help admins troubleshoot and resolve application issues faster.
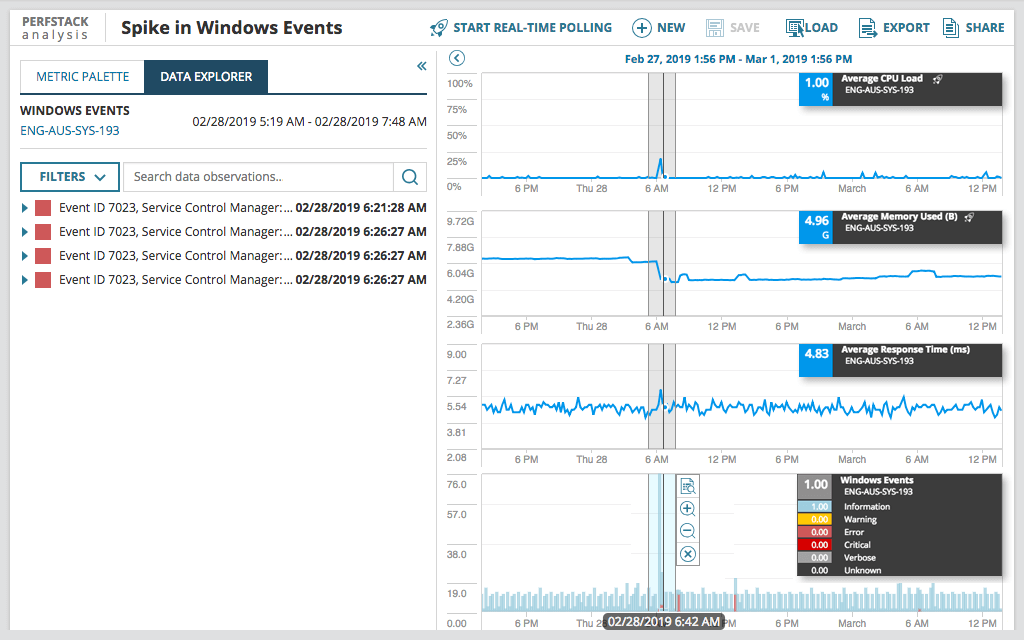
Unified infrastructure monitoring and centralized event log management.
SolarWinds Log Analyzer directly integrates your log and event data into the Orion Platform console so you can easily view log data alongside network and systems performance.
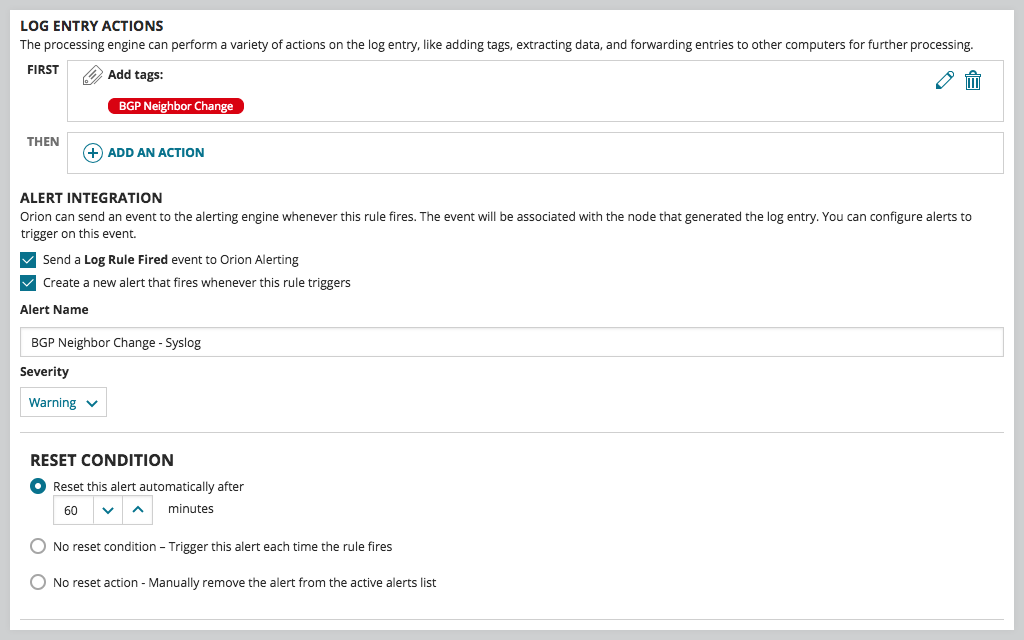
Leverage Orion intelligent alert actions
Be the first to know when issues arise. Log Analyzer integrates with the intelligent alert engine of Orion to provide customizable alerts along with delivery options including email notification, ServiceNow integration, and the triggering of an external script.
Keep your log aggregator from being a dead end
Having your log data in a central location is great for troubleshooting and correlation, but what if you need that useful data in other locations or tools? Log Analyzer allows you to forward logs to other applications, such as ticketing systems or SIEMs, and export log data to CSV files for even more flexibility.
System Requirements:
Server & Application Monitor
| Hardware | Minimum Requirements |
|---|---|
| CPU | Quad core processor or better |
| Memory | 6GB |
| Hard Drive | 20GB minimum |
| Software | Minimum Requirements |
| Database | On-premises SolarWinds supports Express, Standard, or Enterprise versions of the following:
Cloud Amazon RDS |
Log Analyzer
| Type | Requirements |
|---|---|
| LA Database | Physical server or virtual machine Quad core processor or better 16GB RAM 1 x 1 Gb dedicated NIC Windows Server 2016 or 2019, Standard or Datacenter Edition Disk requirements: 100 – 130GB/day (@1000 EPS) on local NTFS disk Microsoft® SQL Server® 2016 SP1 or later Supported collations: English with collation setting SQL_Latin1_General_CP1_CI_AS English with collation setting SQL_Latin1_General_CP1_CS_AS |
| LA/Orion Server | Quad core processor or better Required: 4 cores Recommended: 8 cores HDD: 15GB minimum, 40GB recommended Memory 8GB minimum 16GB recommended |
| Software | Minimum Requirements |
| Operating System | Windows Server 2016, 2019 |
| Operating System Language | English (U.K. or U.S.) |
NOTE: The minimum server requirements listed assume default configuration. Significantly increasing the poll rate or statistic collection rate could result in additional load on the server, which may require a larger CPU or additional memory.
Documentation:
Download the Solarwinds Server & Application Monitor Datasheet (.PDF)
Download the Solarwinds Log Analyzer Datasheet (.PDF)
Get in touch with a Solarwinds Solutions Specialist today to Learn More!