
Solarwinds Server Performance & Configuration Bundle
IT performance monitoring and change detection in a unified solution
.png)
Overview:
Server Performance & Configuration Bundle
- Proactive server and application monitoring
- Hardware and software asset inventory
- 1200+ application performance monitoring templates
- Intelligent application infrastructure dependency mapping
- Track system and application changes
- Correlate configuration changes to performance
Get help knowing when a server is down and how it got there.

Be proactive
Monitor the performance, capacity, and health of Linux and Windows apps across data centers, remote offices, and the cloud.

One dashboard
Monitor 1200+ vendor applications, servers, databases, and storage from a single, easy-to-use, customizable web interface.

Easy to use
Don’t waste your time searching for what’s changed. Quickly see changes so you can fix the problem.
What The Server Performance & Configuration Bundle Includes
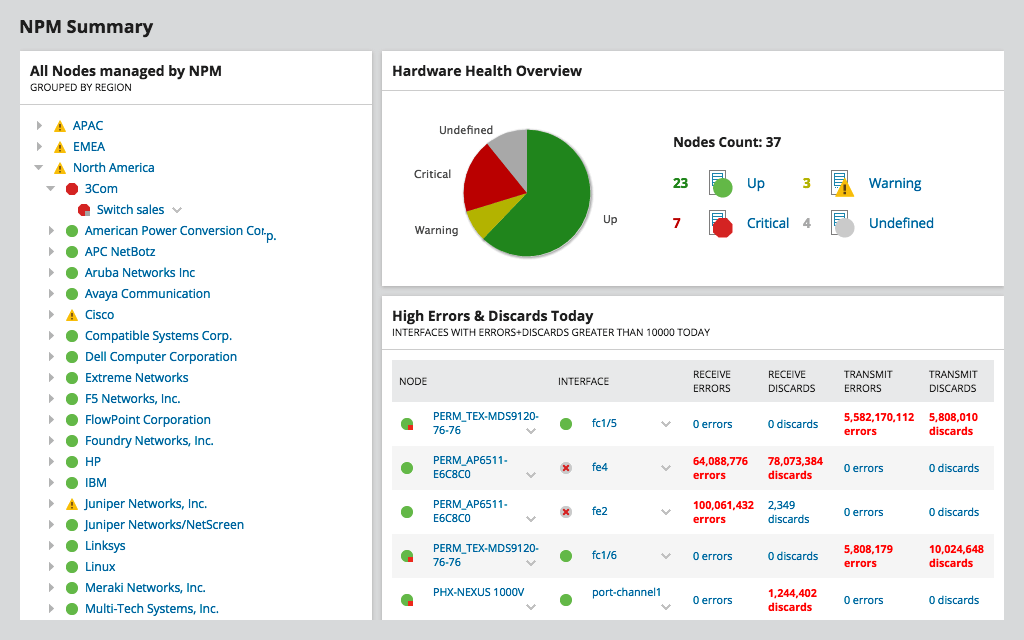
Server & Application Monitor
Comprehensive server and application monitoring made simple
- Get started typically in minutes
- Monitor Azure and AWS IaaS, PaaS, and SaaS
- 1,200+ out-of-the-box monitoring templates, plus more than 1,000 community templates
- Custom monitoring with REST API, WMI, SNMP, and PowerShell scripts
- Customizable server monitoring
- Infrastructure dependency mapping
.png)
Server Configuration Monitor
Gain visibility into systems changes and easily compare configurations over time with our new change monitoring tool
- Baseline server and application configurations on Windows and Linux
- Alert and report on deviations from the baseline in near real time
- See who’s making configuration changes on servers or applications
- Compare current configurations to previous versions
- Correlate configuration changes with performance metrics
- Track server hardware and software inventory
Features:
Be the first to know about server and application issues.
Monitor the performance, capacity, and health of Linux and Windows apps across data centers, remote offices, and in the cloud. Save time with:
- Automated discovery and mapping of applications and infrastructure
- Customizable monitoring templates
- Pre-built alerts and reports
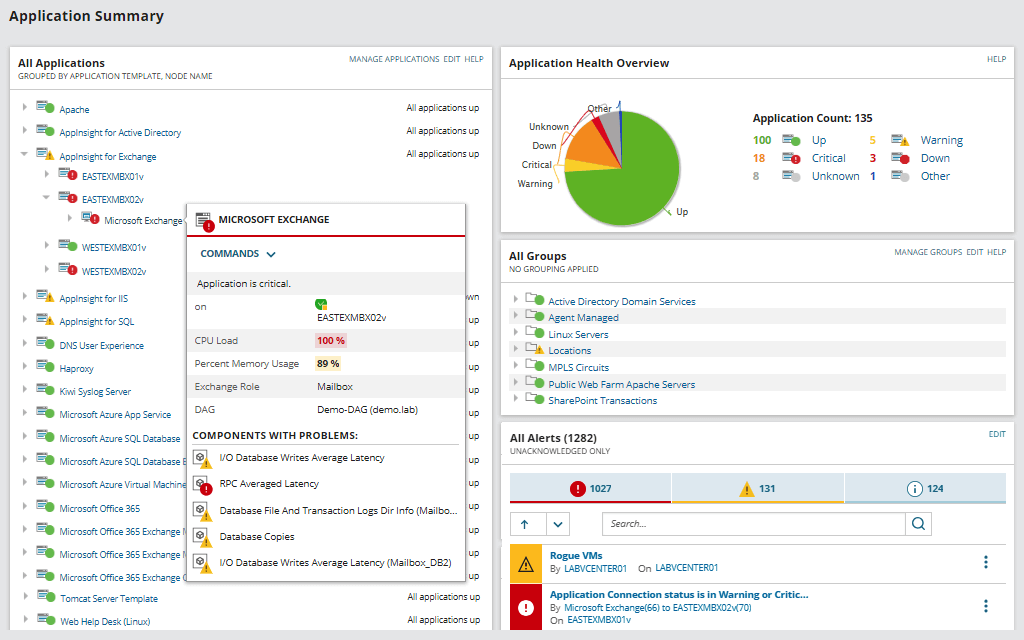
Built-in templates provide best practices.
Application performance monitoring for 1200+ supported applications and systems, such as:
- Active Directory
- Java
- XenApp
- IBM WebSphere
- Skype for Business
- Office 365 email
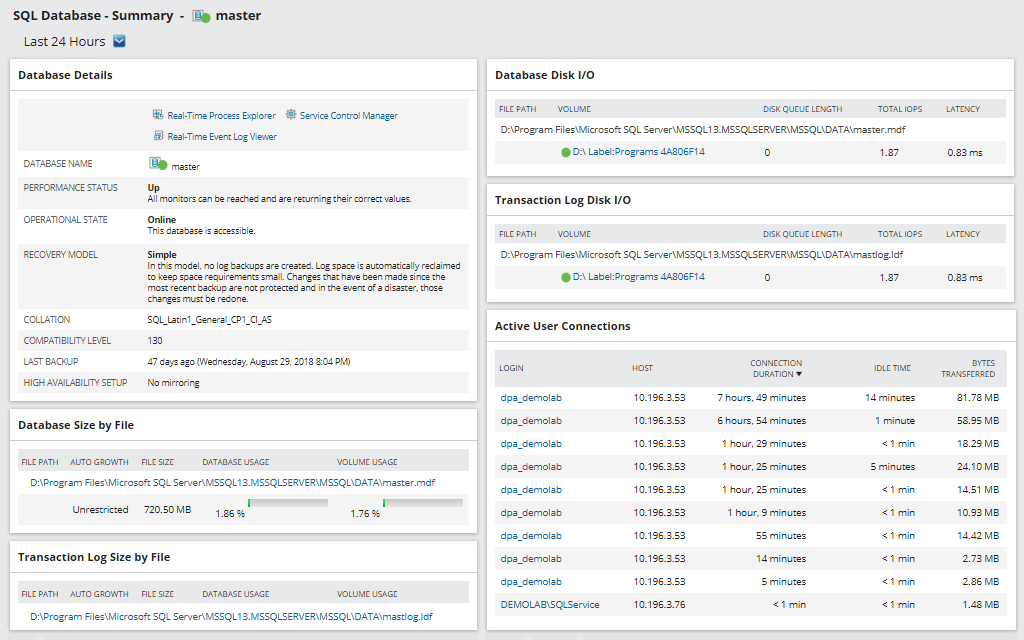
Get more in-depth application monitoring with AppInsight™ dashboards for Exchange, Microsoft IIS, and SQL Server. View code-level application performance detail with APM integration
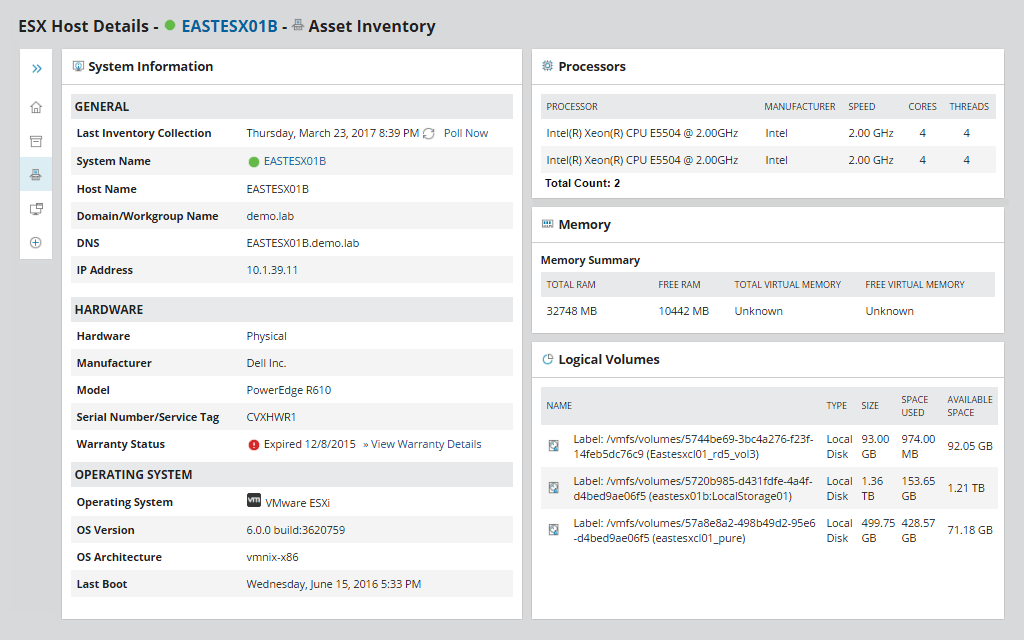
Hardware and software inventory and reports.
Server monitoring software built to automatically discover and help remotely manage hardware and software asset information on all servers and workstations. No more manual tracking with spreadsheets.
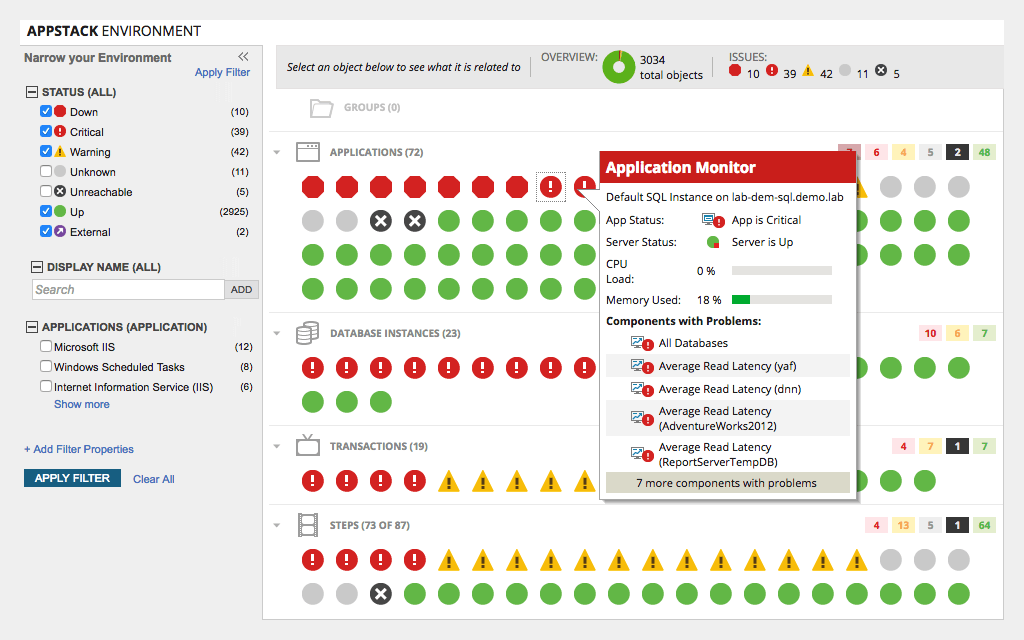
Get insights across the application stack.
Customizable maps can help you easily create logical application groups. Quickly visualize cross-server communication and application dependencies. Map infrastructure dependencies to see a more complete picture, helping you pinpoint the root cause of application performance issues. Be able to identify where application issues originate typically in just a few seconds.
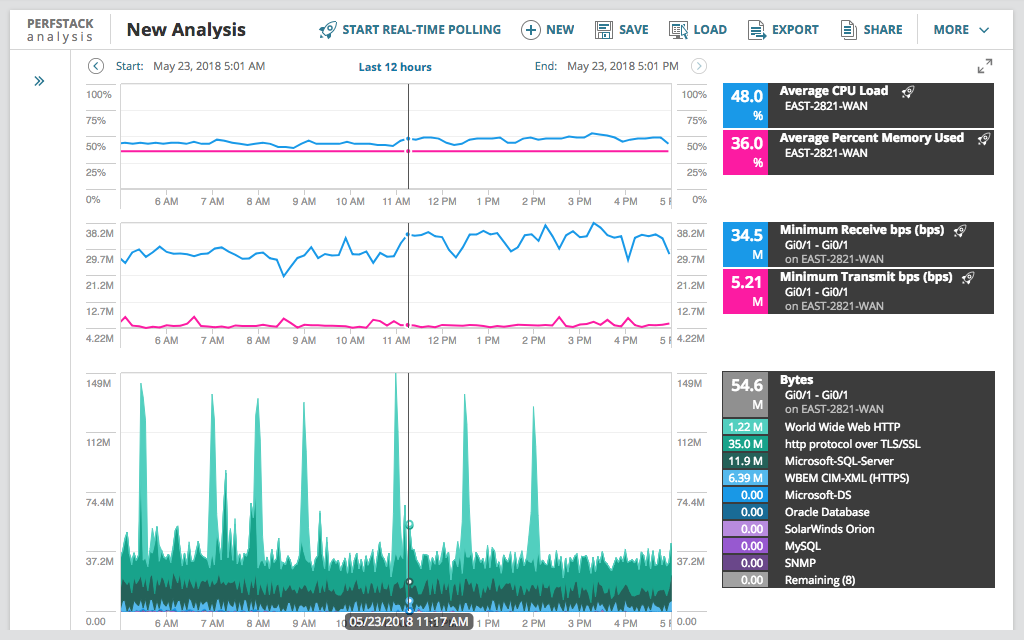
Cross-stack IT data correlation.
The PerfStack™ performance analysis dashboard helps you to drag, drop, and overlay performance metrics from your systems data and multiple sources (such as network, virtualization, or storage), and view data types on a single chart.
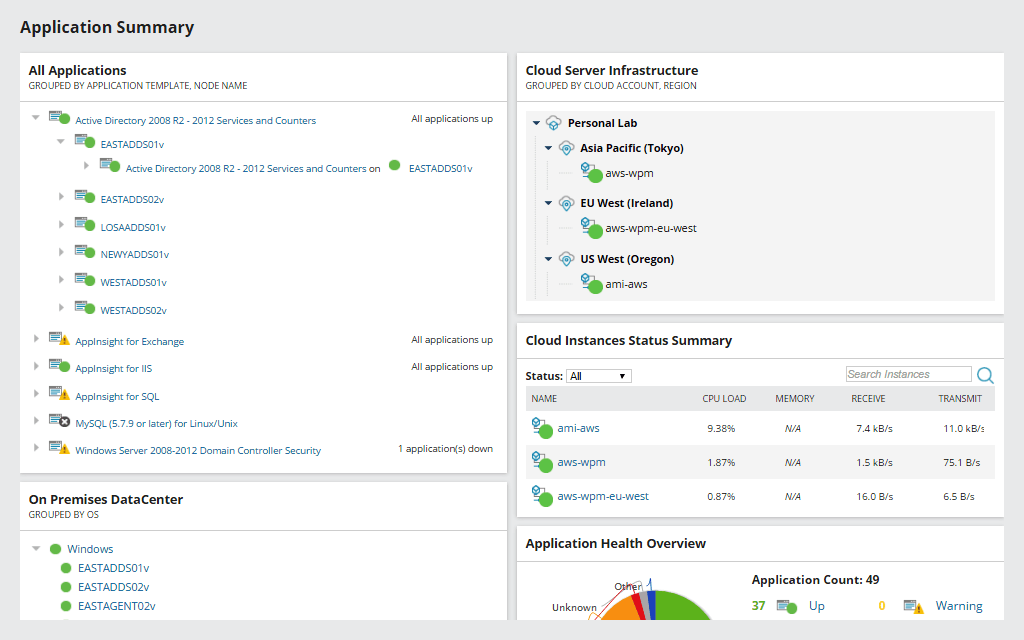
Monitor your physical, Hyper-V, and VMware environments.
Monitor the health and performance of your on-prem and hosted infrastructure, including physical servers, virtual hosts and guests, and storage.
Quickly monitor the performance and availability of Microsoft Azure and Amazon AWS infrastructure.
Monitor the Infrastructure as a Service (IaaS) for Amazon AWS and Microsoft Azure. Provide end-to-end systems performance and application monitoring using agent-based and agentless technologies for application and systems metrics. Monitor across multiple data centers, remote locations, and other cloud providers.
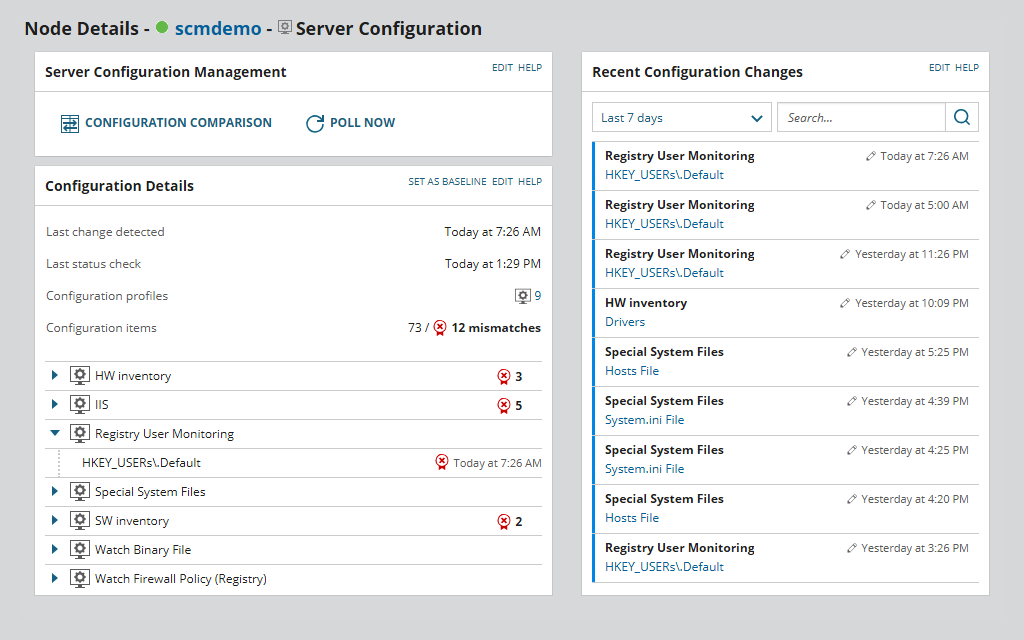
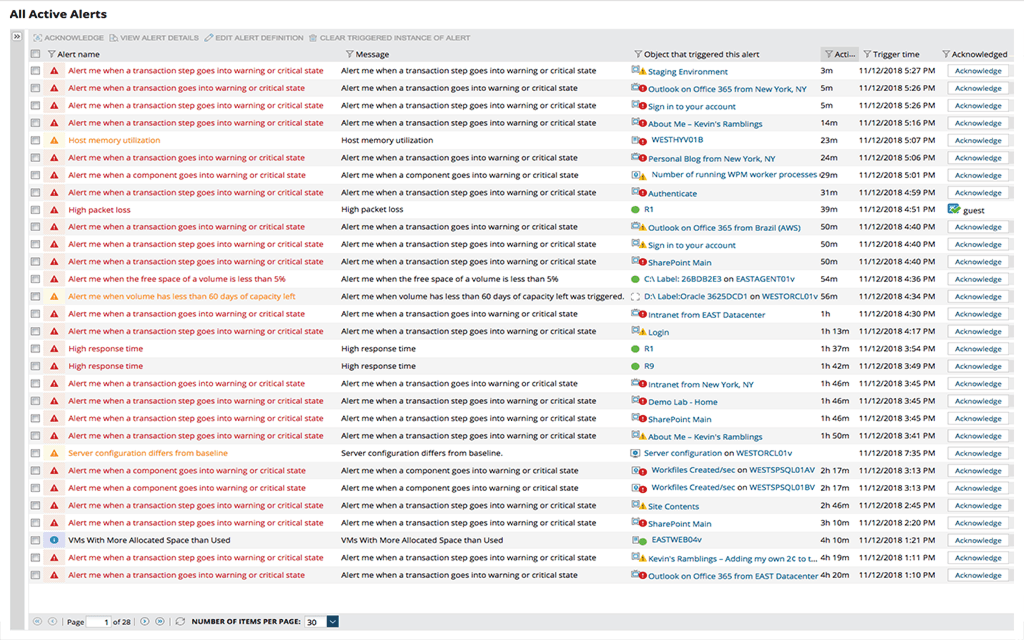
Get alerts on and track system and application changes.
Systems and applications change constantly. Knowing when these changes took place and what changed can be difficult and time consuming. Receive alerts on system and application changes so you can more efficiently track them.
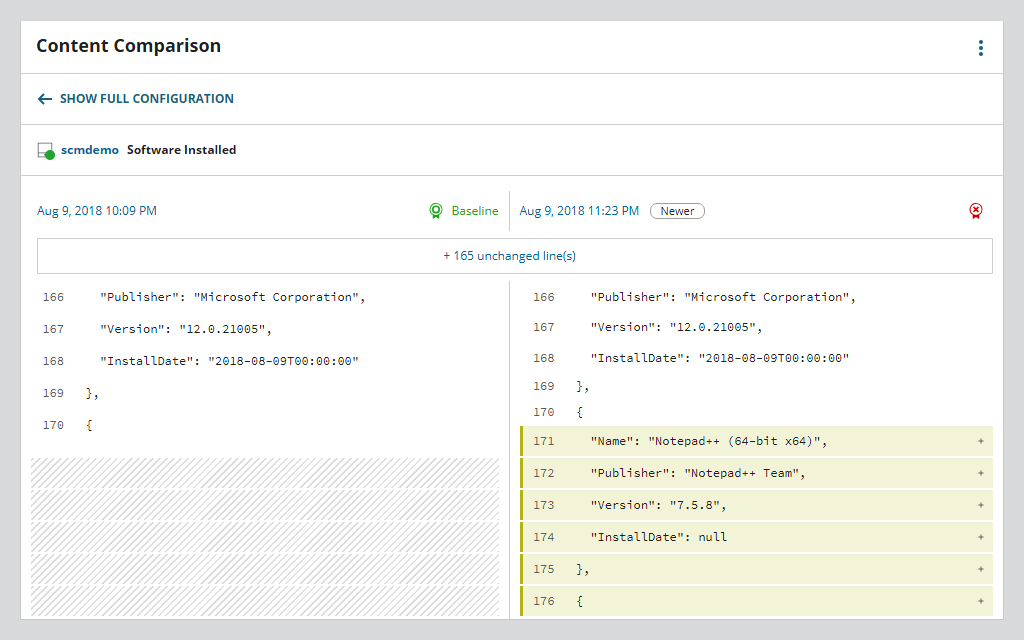
Compare configurations between any time periods.
Compare configurations to view changes over time. Creating baselines to use as points of reference for future configuration comparisons can simplify application and server configuration monitoring.
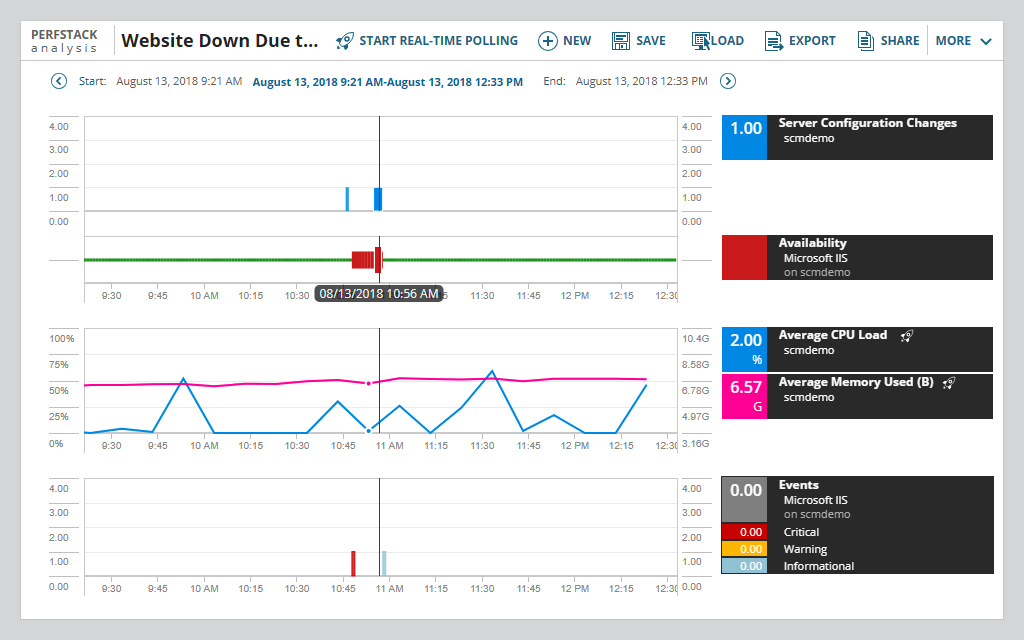
Are your configuration changes helping or hurting?
Correlate configuration change details with other performance metrics on a visual.
System Requirements:
Server & Application Monitor
| Hardware | Minimum Requirements |
|---|---|
| CPU | Quad core processor or better |
| Memory | 6GB |
| Hard Drive | 20GB minimum |
| Software | Minimum Requirements |
| Database | On-premises SolarWinds supports Express, Standard, or Enterprise versions of the following:
Cloud Amazon RDS |
Server Configuration Monitor
Orion Platform products can be deployed on physical or virtual servers on-Orion Platform products can be deployed on physical or virtual servers on-premises or in the cloud. These products can also be deployed via the Azure or AWS marketplaces. For detailed system requirements, visit support.solarwinds.com.
NOTE: The minimum server requirements listed assume default configuration. Significantly increasing the poll rate or statistic collection rate could result in additional load on the server, which may require a larger CPU or additional memory.
Documentation:
Download the Solarwinds Server & Application Monitor Datasheet (.PDF)
Download the Solarwinds Server Configuration Monitor Datasheet (.PDF)
Get in touch with a Solarwinds Solutions Specialist today to Learn More!