
Solarwinds AppOptics
SaaS-based APM and infrastructure tool for hybrid and cloud-native IT environments
Overview:
SaaS-based simple, powerful, and affordable infrastructure and application monitoring (APM) for custom on-premises, cloud, and hybrid systems.
Your business runs on applications, and when they go down or run slowly, it can impact the business in lost productivity, customers, or revenue. To add to the complexity, your IT environment is changing, and workloads can be spread across data centers and cloud resources. You need to monitor the availability and performance of applications and infrastructure, regardless of where they are, so you can identify potential issues early and address them before they impact users
Boost your application performance monitoring coverage.
Do you find yourself asking…
What if the number of applications I can monitor is limited because of cost and time to switch?
Let the SolarWinds® AppOptics™ infrastructure and application monitoring solution help fill the gaps while running alongside. AppOptics is a simple and powerful APM solution without the cost or complexity.
How can I minimize my mean time to resolution (MTTR)?
SolarWinds® AppOptics™ is known for its troubleshooting triple threat—distributed tracing, live code profiling, and exception tracking—allowing users to rapidly solve performance issues in complex systems.
I’m not a level 3 engineer. Why does it feel like I need to be one to understand APM?
AppOptics does the heavy lifting and provides simplified root cause summaries for your services and traces, and pinpoints application problems for you.
AppOptics At A Glance
- Full-stack visibility – Monitor the health and performance of custom on-premises and highly distributed cloud applications across services, hosts, containers, and platforms down to the code.
- Reduce MTTR – Monitoring infrastructure and application metrics side-by-side reduces the time it takes to identify what part of the stack is failing, so you can quickly get to the root cause.
- Auto-instrumented root cause – Quickly pinpoint issues and present the most likely cause of a performance problem. Takes the guesswork out of troubleshooting.
- Simple setup – Up and running typically in minutes, easy to use, and a minimal learning curve for IT professionals.
- Integration that matters– Cohesive end-to-end monitoring enables maximum observability from metrics, to traces, and down to logs.
- Align your performance goals with business goals – Incorporate custom metrics to combine business metrics side-by-side with system metrics. See and measure the impact infrastructure and application performance has on your business performance.
- Highly scalable – Cost-effectively scale as your business scales with analytics and trend reporting, providing you with insights into short- and long-term changes to performance and resource utilization.
Who Is It For?
- System admins
- Monitoring engineers
- SRE/DevOps engineers
- Developers
- QA/Testing
- IT Ops managers
- Application owners
Features Overview
AppOptics speeds root cause analysis of application performance issues across AWS, Azure, and hybrid environments.

Unprecedented Visibility
Complete visibility into the health and performance of your applications and their supporting infrastructure.

Performing as Designed
Create performance metrics to automate monitoring of business-critical services and applications.

Quick Problem Identification, Fast Resolution
Minimize downtime with early warning notifications. If systems fail, help ensure you can recover quickly.

Cost-effectively Scale with Your Business
Support the ebbs and flows of your business. Use a cloud-scale APM tool designed for today’s dynamic IT environment.
Features:
- Comprehensive APM - Unified dashboards, alerting, and management for full-stack monitoring. AppOptics removes the wall between infrastructure and application metrics, allowing combined dashboards and application performance alerting
- Server, virtual host, and containers – A comprehensive set of turnkey infrastructure integrations included, with dozens of AWS and Azure services, web, database, network, containers, orchestrations like Docker and Kubernetes, and more.
- Host and container maps – Avoid downtime with color-coded heatmaps and get proactive notifications when your infrastructure resources violate defined performance thresholds.
- Host detail views – Monitor your legacy and new IT implementations with simple-to-click drilldowns into resource utilization and performance by services, containers, and processes.
- Service-, and trace-level summaries – Pinpoint the root cause of performance problems without drilling down, enabling you troubleshoot issues like latency, volume, error rate, and slowdowns without digging into the details. We make it easy to understand every trace and summarize critical details.
- Application service map – Visualize the relationships between services and their dependencies to understand the scope of an issue and triage it faster.
- Distributed tracing – AppOptics ties together the path of an entire request into a trace, so even as you add internal services or APIs, you’ll know the link between deep-down bottlenecks and user impact.
- Live code profiling – Enables you to identify the slow method that was introduced, speeding up the turnaround time, and allowing the feature to get out faster.
- Exception tracking – Provides a summary of exceptions happening within a service context, from the current volume of exceptions, when they started, to which exceptions are most frequent. You can even drill into each exception, viewing the stack trace, and which endpoints in the application are throwing them.
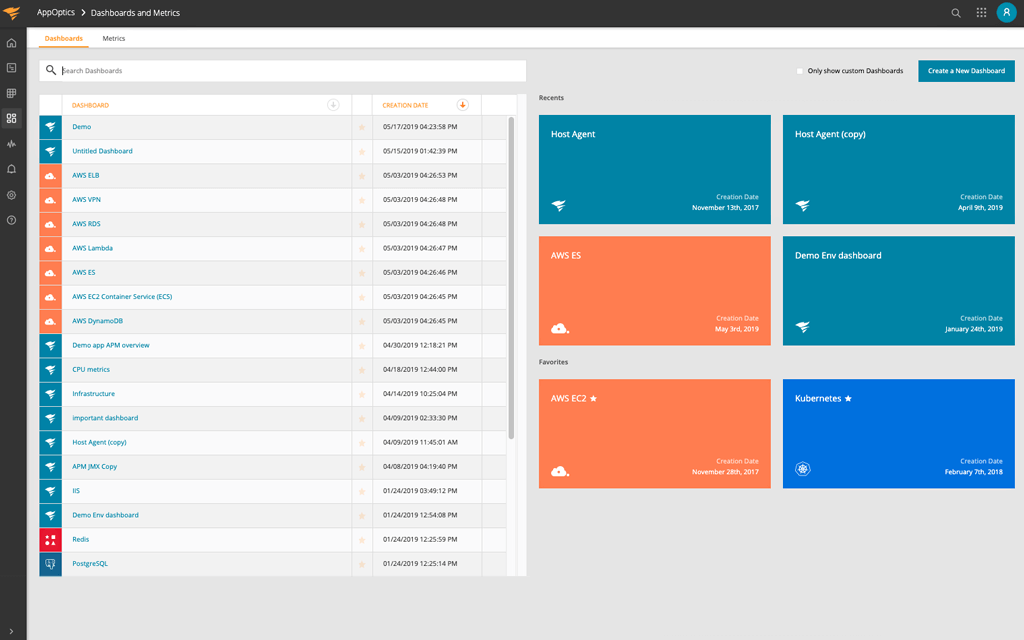
- Customizable dashboards and reports – Communicate and collaborate across the team with shared dashboards and reports, and integrations with team solutions like Slack®, PagerDuty®, and custom webhooks.
- Custom metrics – Analyze custom infrastructure, application, and business metrics. Send any type of metric to AppOptics, be it via language bindings, opensource collection agents, or even a simple curl command. Easily overlay timeshifted data to understand growth, trends, and problems.
- Integrated with SolarWinds® Loggly® – Combine metrics, traces, and logs for one-click drill down into log lines associated with a specific host or transaction trace, all in one user interface.
Challenges Addressed:
- Ability to afford monitoring your business-critical applications
- Simple to use even if you don’t have intimate knowledge of each application
- Complete visibility into the health and performance of our applications and their underlying infrastructure
- Our applications meet service-level objectives and perform the way they were designed to
- Ability to quickly pinpoint the root cause of performance issues across the stack, down to a poor-performing line of code
- Reduce downtime and impact to users due to application errors, resource allocation, or performance issues across the stack.
- Confidence that our performance monitoring tool can scale with you technically and cost-effectively
- Maximum observability through tight integration with Log Management and Analytics (powered by SolarWinds Loggly) functionality
Screenshots:
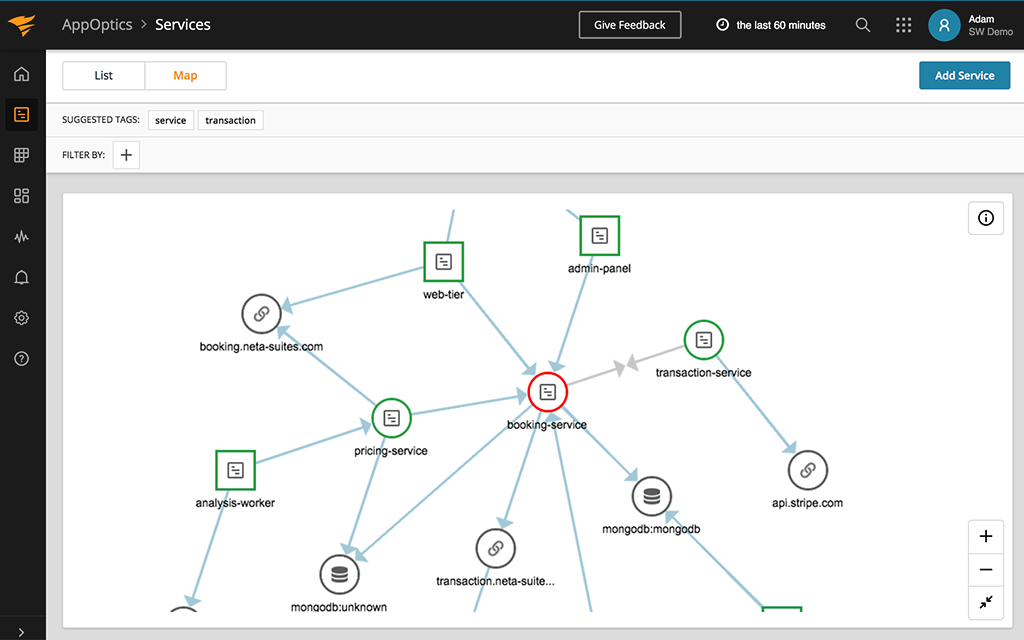
Provide users with a view showing the relationships between services and their dependencies
The service map is meant to provide context for how a service or dependency translates to end-user performance. With the application service map, you can move into a particular service to view more detailed performance metrics (root cause of service degradation, transaction traces, exceptions, performance over time, etc.).
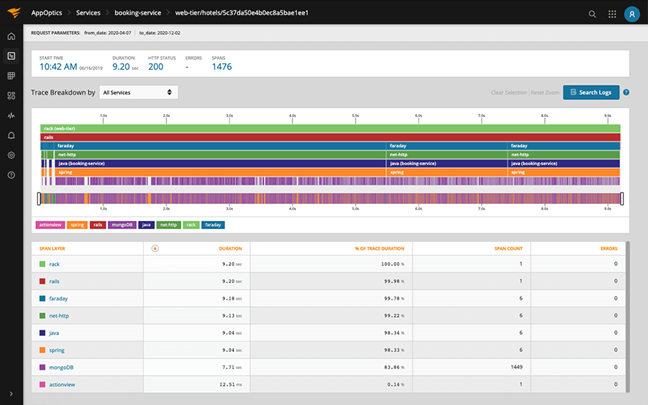
Find slow queries, bugs, inefficient code, or problems with the infrastructure.
AppOptics trace- and service-level root cause simplify pinpointing application performance issues. These simplified views work for legacy monolithic applications just as well as they work for modern apps running in Kubernetes. Remove the guesswork from your incident response and have your teams focus on working together to solve the problem.
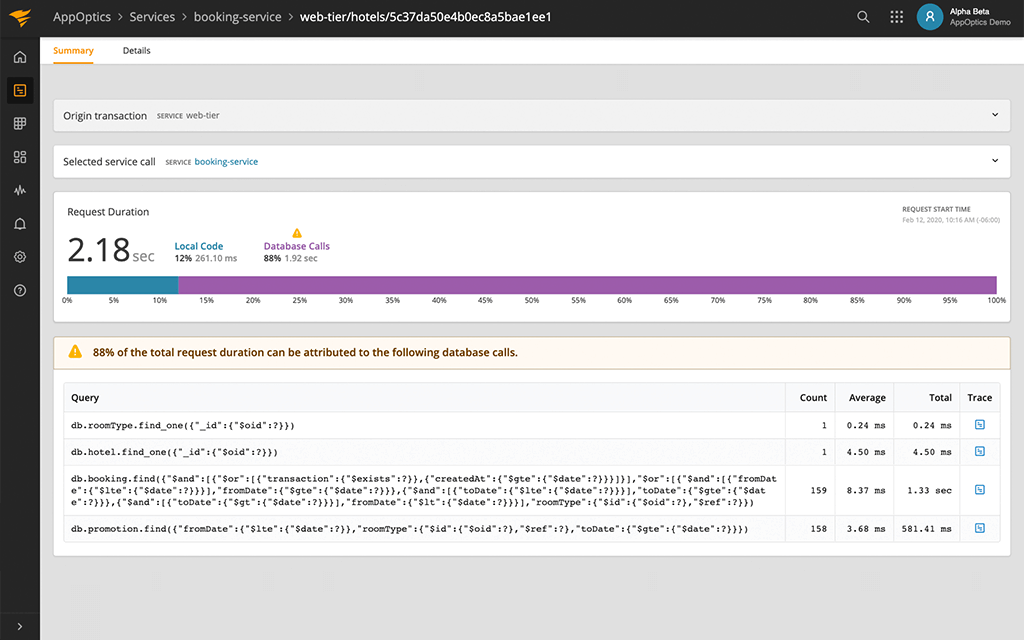
Comprehensive performance monitoring, from custom on-premises to your highly distributed cloud applications, in one product.
AppOptics performance monitoring goes deep and wide, including applications, transactions, services, servers, hosts, containers, and serverless. It’s powerful made simple with auto-instrumentation, a one-click connection from hosts and transactions to their associated logs, and simplified root cause summaries, making APM valuable in just about anyone’s hands.
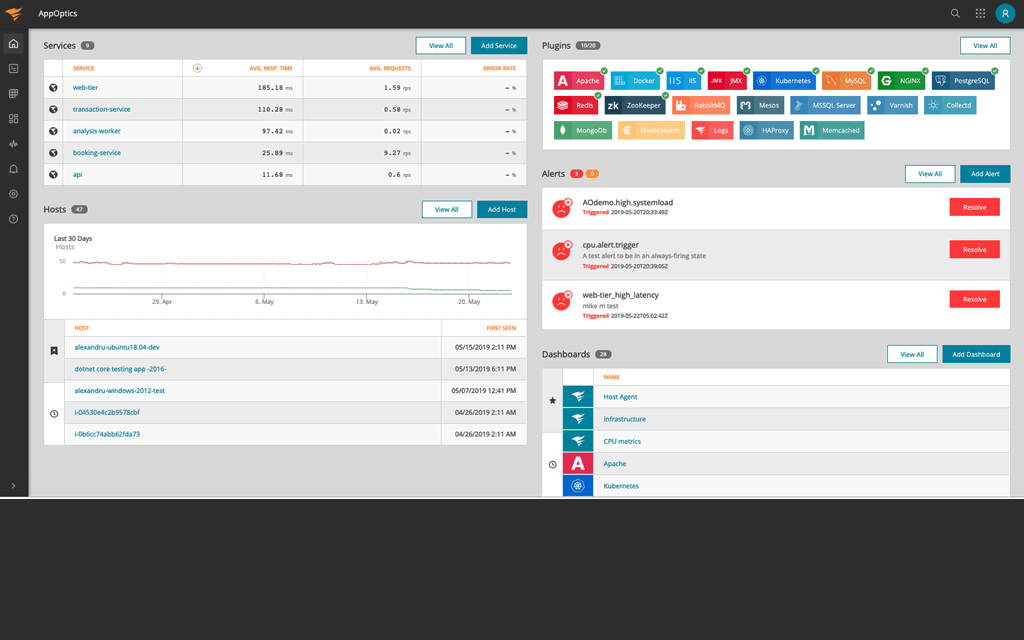
Remove the wall between Application and Infrastructure metrics, allowing combined dashboards.
Get a bird's-eye view across all your servers, hosts, containers, and serverless environments. Cross-reference application and infrastructure metrics side by side in the same dashboard.
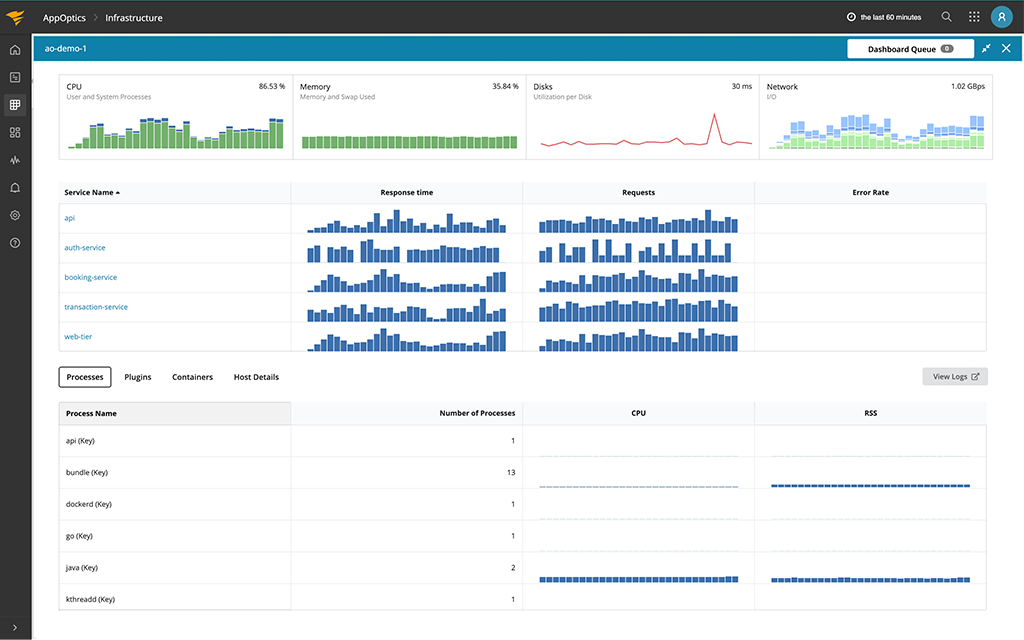
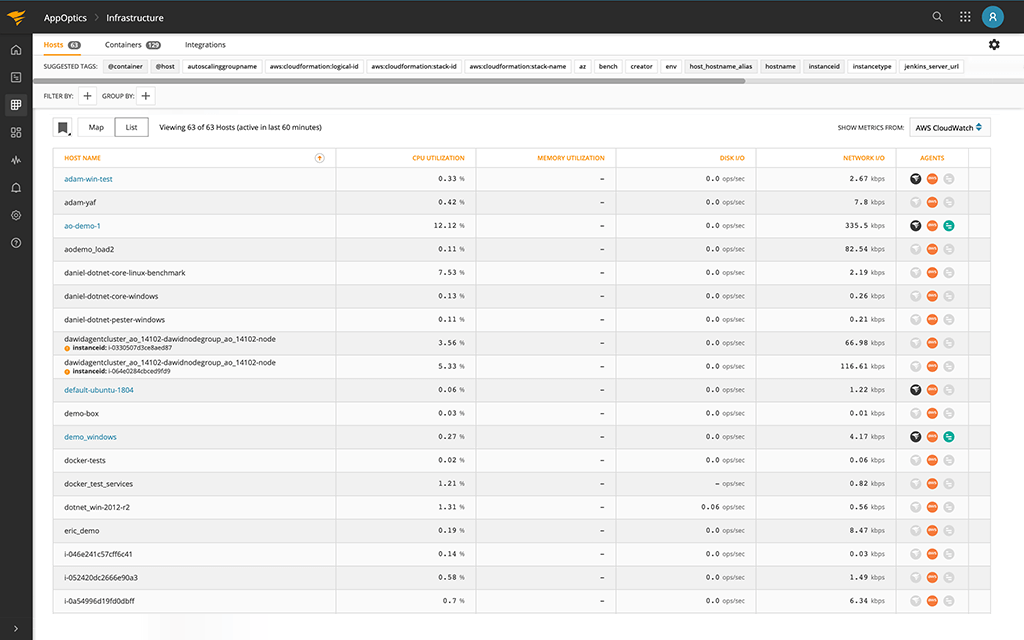
Consolidated monitoring of all your servers, hosts, containers, and serverless environments.
Infrastructure monitoring for your legacy and new IT implementations with simple-to-click drilldowns into resource utilization and performance by services, containers, and processes.
SaaS-based monitoring of your AWS services and custom applications.
Monitor over 30 AWS services with broad application language support (.Net, Java, PHP, Python, Scala, Node.js, Go, and Ruby).
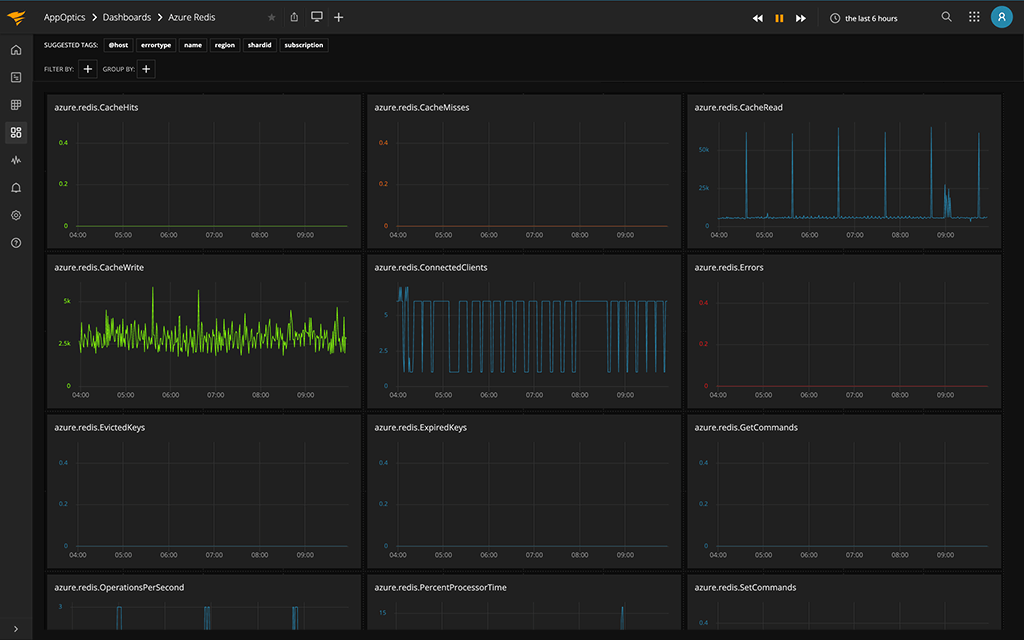
SaaS-based monitoring of your Azure services and custom applications.
Monitor Azure services including Load Balancer, Cosmos DB, SQL Database, Redis, and Azure App Services with broad application language support (Java, PHP, Python, Scala, Node.js, Go, and Ruby).
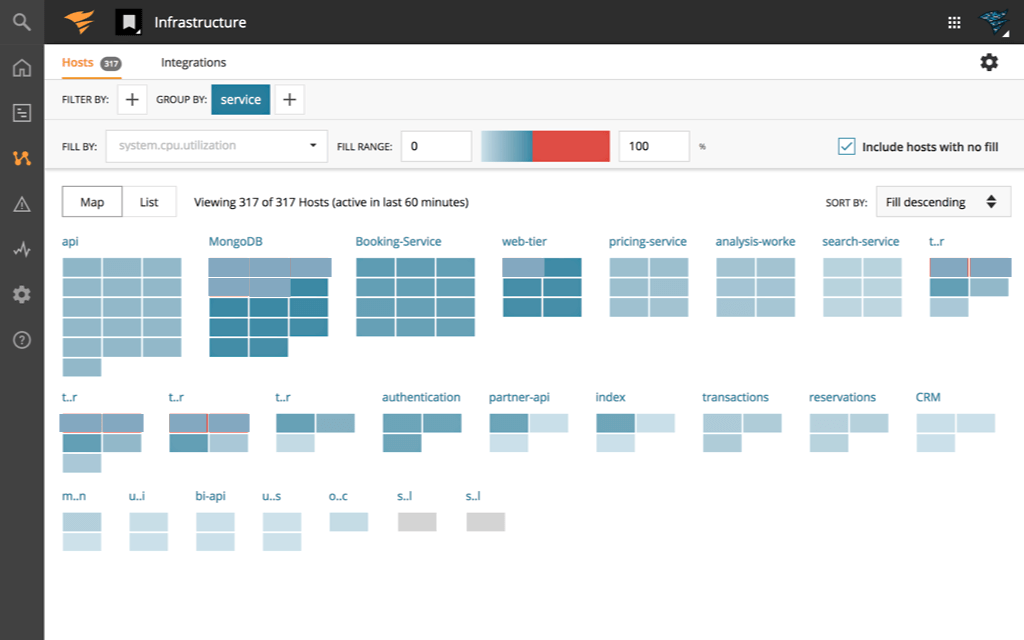
Quickly identify which hosts have exceeded thresholds and could be impacting application availability and performance.
Avoid downtime with color-coded heatmaps that provide visualizations of all your hosts, and containers with comprehensive alerting on key performance metrics across the stack.
With over 150 out-of-the-box plugins, integrations, and custom metrics, you have everything you need to monitor your critical systems.
Measure what matters with AppOptics. It's an APM tool offering the ability to perform full-stack monitoring of your systems, including key business metrics associated with those applications.
Collect, search, and analyze the log data of your applications and supporting infrastructure to quickly pinpoint problems.
Achieve complete observability by integrating your metric, trace, and log data into a single integrated APM experience. Accelerate troubleshooting and identification of the root cause of performance issues.
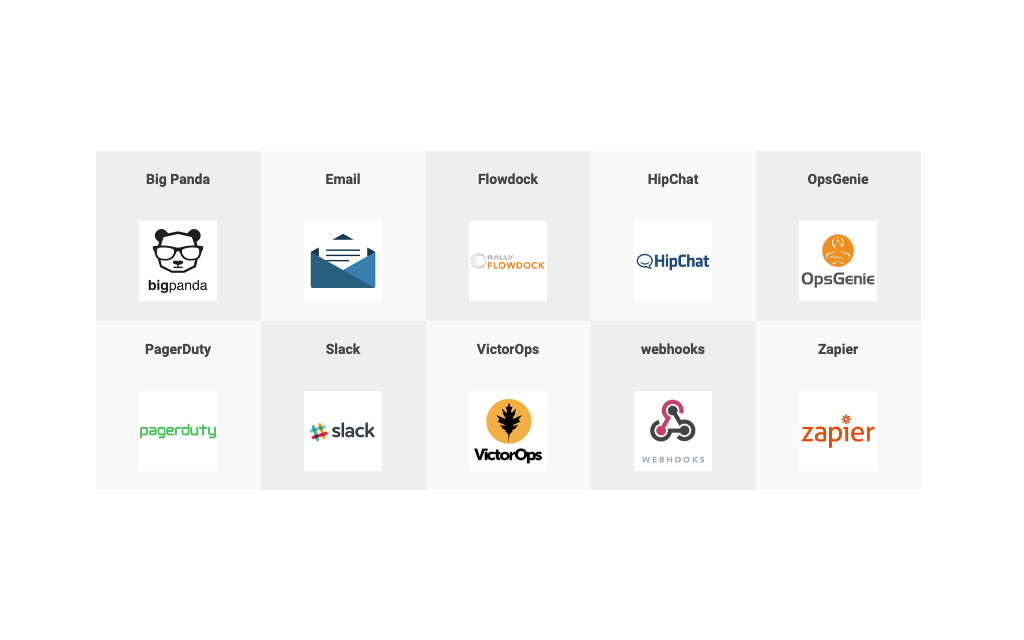
Be the first to know when there’s an availability or performance issue.
Single pane of glass visualization of thresholds that have been exceeded, paired with comprehensive alerting through major notification services like Slack, PagerDuty, Opsgenie, email, webhooks, and more.
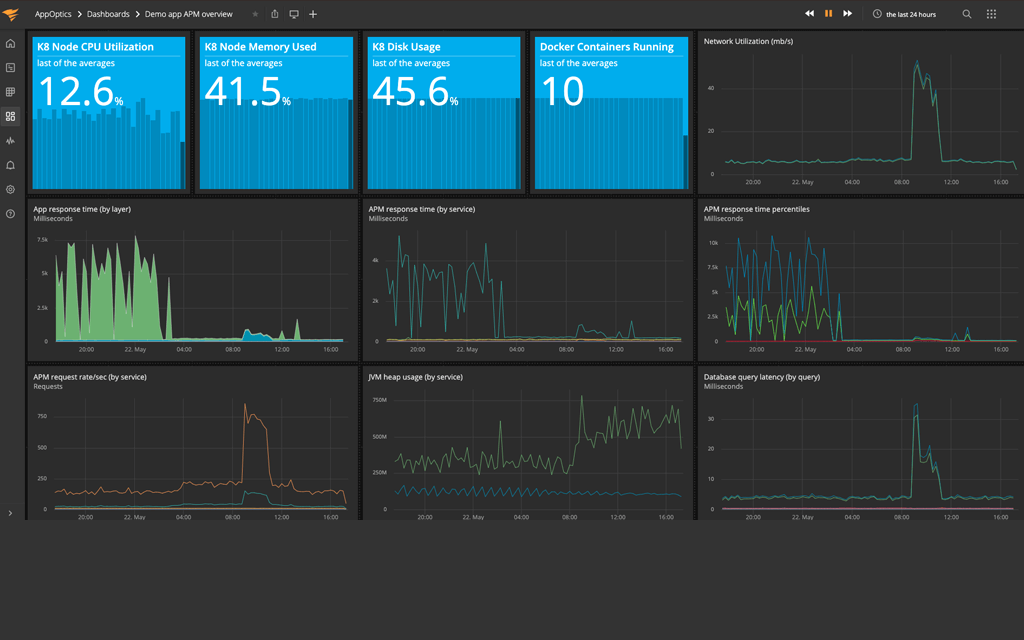
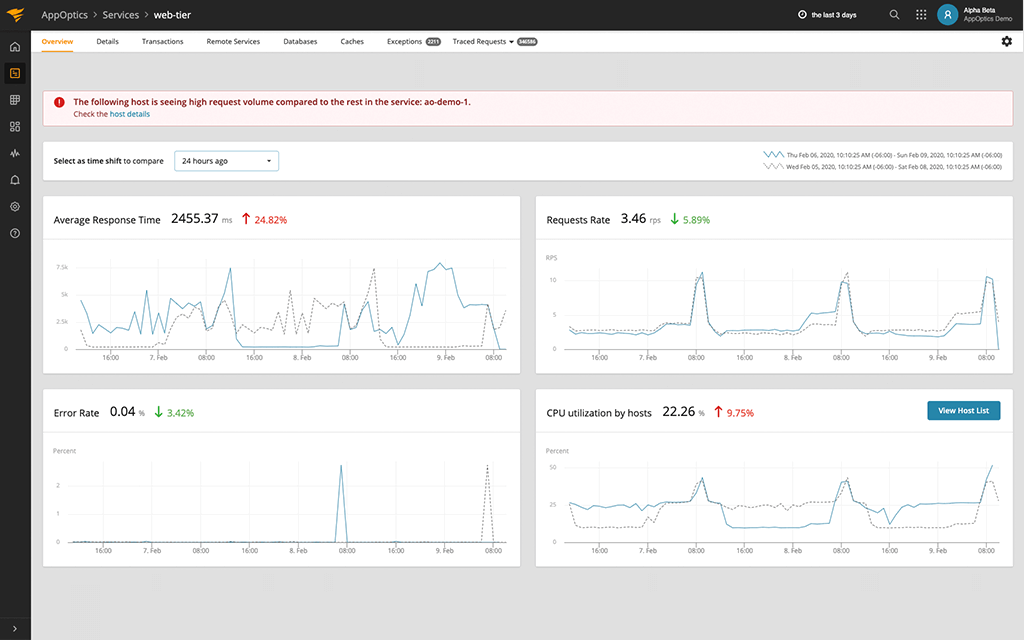
AppOptics is a converged APM tool bringing application and infrastructure monitoring together on common dashboards.
Monitoring infrastructure and application metrics side by side, reduces the time it takes to identify what part of the stack is failing, so you can quickly get to root cause.
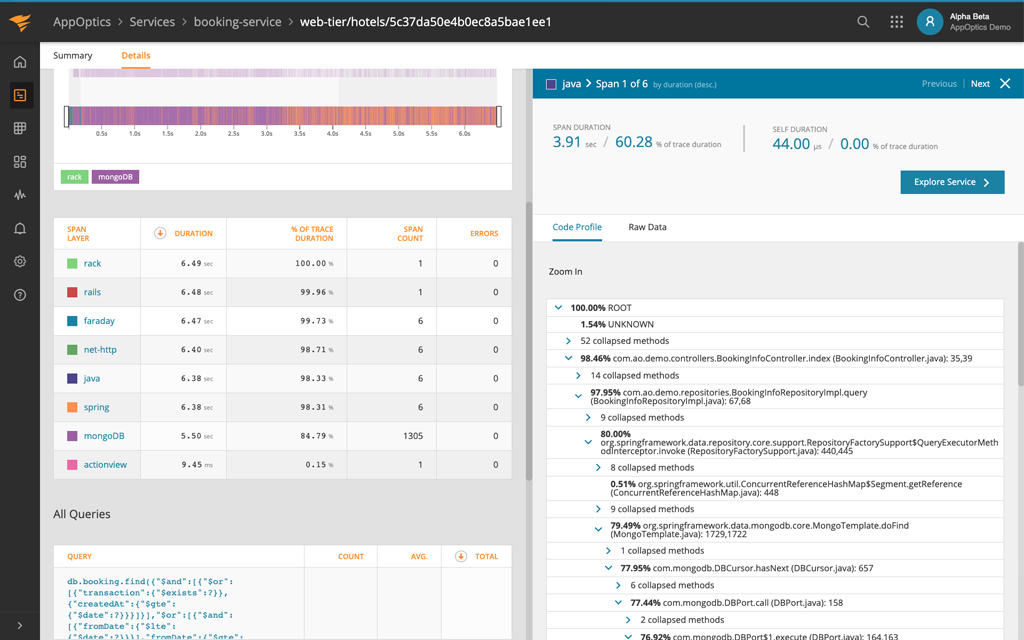
Thread the needle on application performance issues by identifying the functioning code causing the problem.
Code profiling combined with distributed trace enables you to go beyond the poor-performing service and identify the line of code causing the poor performance.
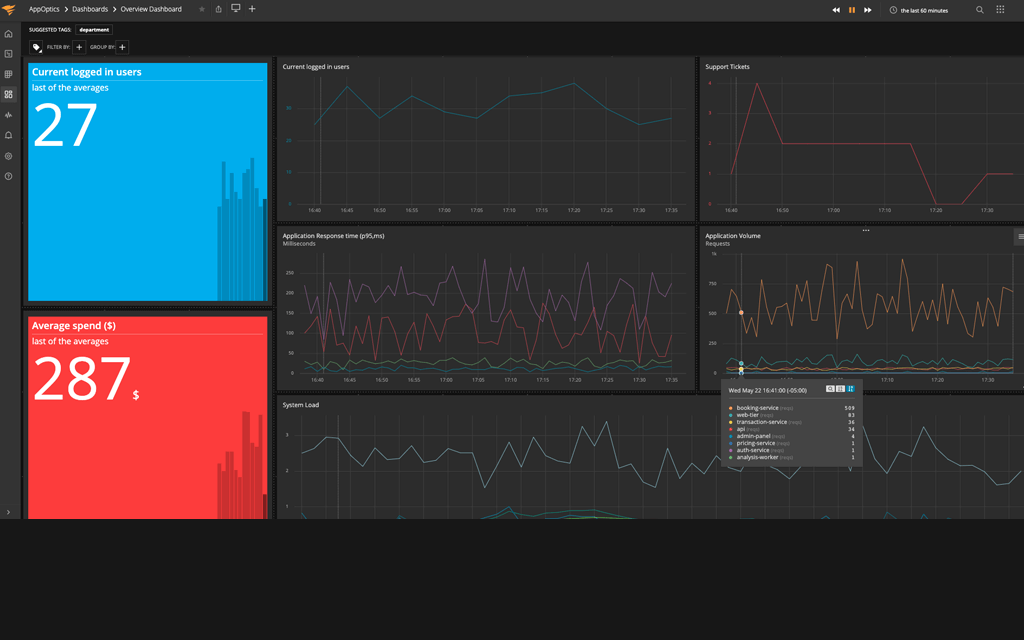
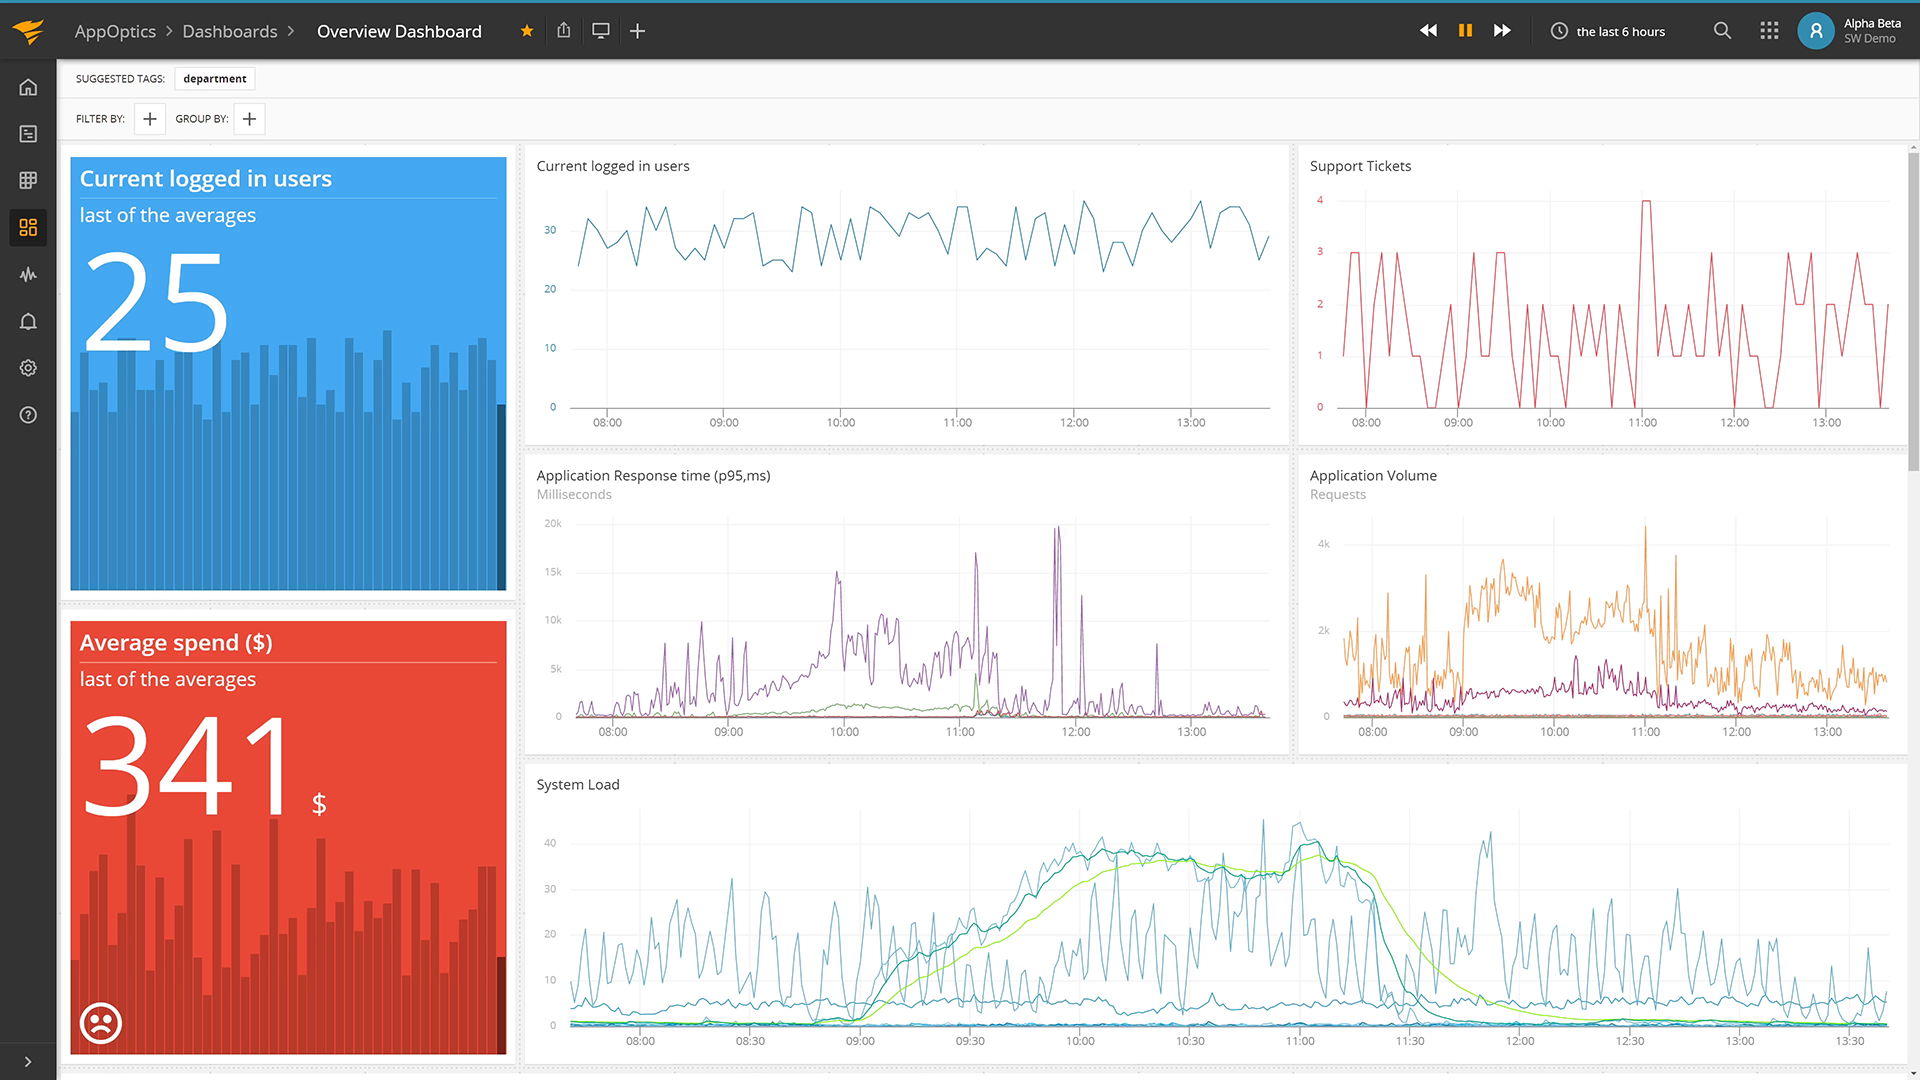
Use AppOptics to measure application and business performance and their impact on your business.
Incorporate custom metrics to combine business metrics side by side with system metrics. See and measure the impact infrastructure and application performance has on your business performance.
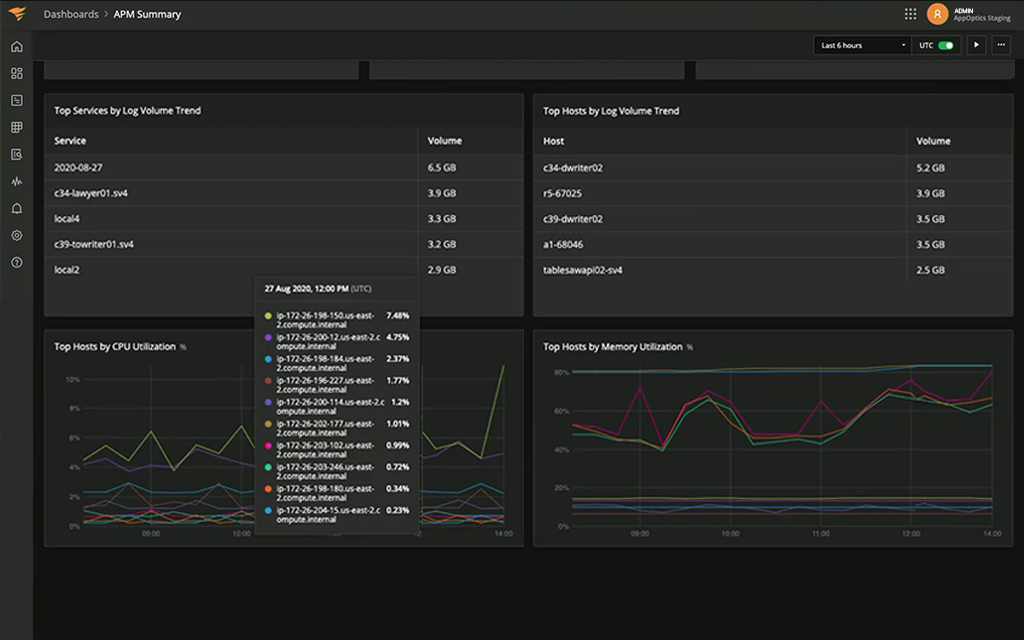
Correlate resource allocation to application performance, so you use what you need—no more, no less.
Leverage out-of-the-box dashboards and analytics to maximize performance while ensuring you don’t overspend or under-utilize precious on-premises and cloud resources.
Powerful infrastructure and application performance monitoring, without the cost or complexity
NOTE: *Sold in packs of 10 hosts, 100 containers
Documentation:
Download the Solarwinds AppOptics Datasheet (.PDF)
Get in touch with a Solarwinds Solutions Specialist today to Learn More!