Solarwinds PostgreSQL Monitoring Tool for Performance, Lock, and Activity
Measure Postgres query, process, and metrics in your DB
Overview - Database Performance Monitor:
Open-Source Database Performance Monitoring
Database Performance Monitor (DPM) provides deep database performance monitoring at scale, without overhead. Our SaaS-based platform helps increase system performance, team efficiency, and infrastructure cost savings by offering full visibility into major open-source databases including MySQL, PostgreSQL, MongoDB, Amazon Aurora, and Redis.
Features Overview
- 24/7 monitoring, for both real-time and historical analysis
- One-second granularity helps you spot and diagnose small performance issues
- Compare queries, databases, and more with custom side-by-side views
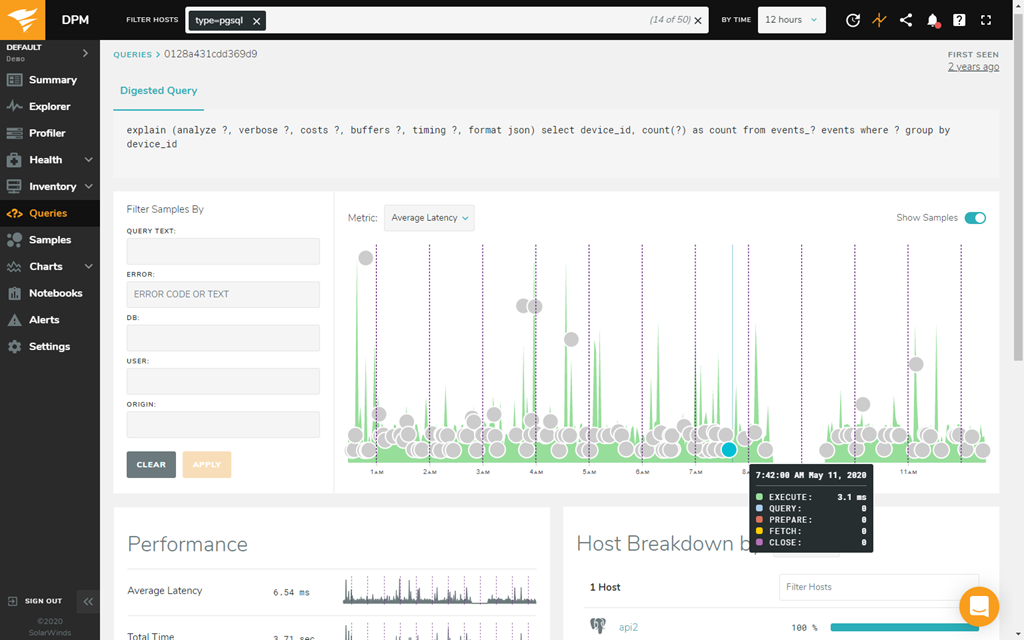
- Comprehensive database performance analytics include query samples and explain plans
- Weekly and daily summary reports and customizable alerts
- Unified view of all your database types and servers to understand your system
- Meaningful summaries show you golden signals of service quality and health for database and system performance
Database Support

Features - PostgreSQL Monitoring Tool:
Monitor and optimize queries for your PostgreSQL deployment
SolarWinds® Database Performance Monitor (DPM) can collect, analyze, and visualize the performance data you need to pinpoint PostgreSQL performance issues. DPM measures latency, throughput, errors, warnings, index usage, execution plans, and more for queries executed and provides PostgreSQL lock monitoring. Designed by IT professionals for IT professionals, DPM is built to be intuitive and easy to use, allowing you to drill down from a global view to examine specific problem queries on individual servers with a few clicks.
Collect detailed Postgres performance monitoring metrics
DPM provides powerful PostgreSQL monitoring tools for measuring a broad set of system metrics in addition to metrics exposed by PostgreSQL. DPM can also monitor and classify multi-dimensional data on queries, users, databases, and processes, in addition to tracking the disk usage, CPU, and other system components. DPM is built to capture over 10,000 metrics every second—a powerful combination of features designed to provide the insights you need to quickly diagnose and solve performance problems in minutes, rather than hours or days.
Use cloud-based PostgreSQL monitoring tools
Since DPM is a Software as a Service (SaaS) tool, there’s nothing to provision, buy, or maintain to use this PostgreSQL monitoring solution. DPM is also updated and upgraded regularly, automatically giving you access to new features and capabilities.
From installation to resource usage, DPM is built to get you up and running as quickly and efficiently as possible. DPM passive agents are built to auto-discover your databases and network resources, using techniques such as network traffic capture and system view inspection. The agents are also designed to be highly safe with data encryption in-flight and at-rest, requiring no inbound network access and are built to use less than 1% CPU.
Analyze metrics with adaptive fault detection and big data analytics
In addition to PostgreSQL monitoring tools, DPM features a state-of-the-art, big data analytics platform featuring advanced techniques like regression analysis and queueing theory to deliver unmatched insight into the relationships between queries, CPU, I/O, and more.
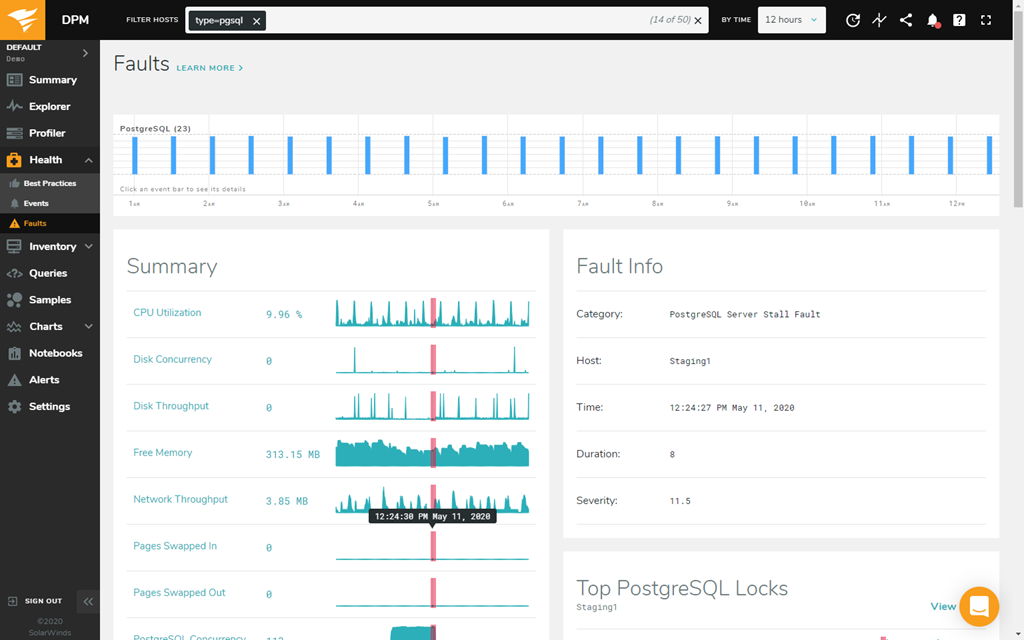
With its adaptive fault detection feature, DPM can also help you find small interruptions to server or service availability, such as micro-fine server stalls, for each PostgreSQL database.
Support multiple teams with the versatility of DPM PostgreSQL monitoring tools
DPM is designed for cross-functional teams by enabling application developers and database admins to work better together for efficient problem solving. Easy integration with chat, deep-linking, quick sharing, and other features help streamline the process of tracking issues. DPM can also be used in development and staging to catch problems before they’re released to production. DPM is a powerful, affordable, and intuitive solution built to allow teams to analyze production query and server behavior easier.
Key Benefits:
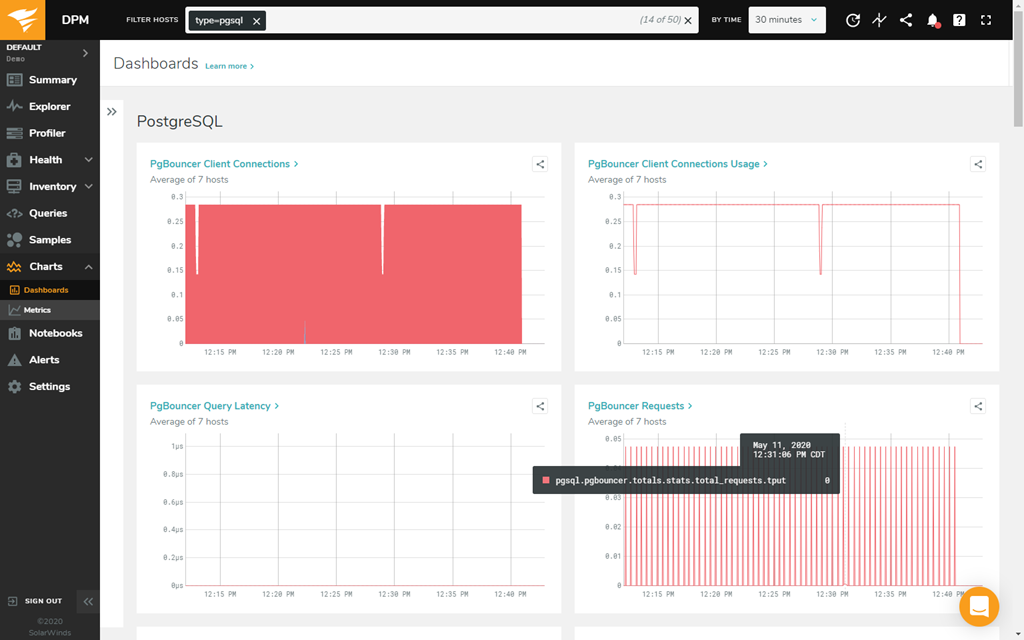
- Visualize thousands of collected metrics across thousands of databases with simple-to-create and -share charts
- Cross-functional team workflow is facilitated with notebooks to create and share knowledge
- Optimize resources and reduce database incidents with one-second resolution into workloads
- Ship better code
- See query response before and after a deployment event
- Examine query details and performance including samples and execution plans
- Compare the performance of your top queries over time
- Troubleshoot and diagnose outages
- Correlate query response or behavior to system metrics to understand impacts
- Isolate unusual behavior and potential contributing factors within the database
- Understand database health
- Track metrics and watch for trends with health summary for databases and systems
- Get recommendations based on best practices
- Explore and examine performance outliers
Details:
- Support for physical, virtual, and cloud-based databases, including AWS RDS
- Architecture
- Secure, cloud-hosted platform
- In-flight and at-rest encryption
- Role-based access control, single sign-on, and SAML integration
- Configurable option to filter customer sensitive data
- Built on the International ISO/IEC 27000 family of standards
- GDPR compliant along with SOC 2 Type II certification
- Alerting and integration module allows for injection warnings to be transmitted directly to email, Slack, Victorops, or any number of messaging systems
PostgreSQL key metrics
Effective Postgres performance monitoring often requires collecting and analyzing substantial amounts of data. While the statistics collector can allow you to monitor PostgreSQL activity and database performance, purpose-built Postgres database monitoring tools are designed to increase the effectiveness of your management capabilities, especially when used to track vital performance metrics, by transforming raw data into easy-to-understand graphs and tables.
Here are some of the most important metrics to track with your PostgreSQL performance monitoring tools:
- Read query throughput and performance: An essential aspect of this is monitoring PostgreSQL query throughput, which provides a sense of how efficiently applications can access information from the database. If the PostgreSQL monitoring tool indicates throughput is low, it’s likely a sign of an underlying issue or inefficiency needing to be examined. One example of this involves sequential scans and opportunities for indexing. If you detect a database is performing an increasing number of scans, for instance, creating a new index may help improve database performance. Sequential scans can also significantly increase a query’s response time, as they read each row of the database tables in sequence. Some PostgreSQL monitoring solutions can also suggest new indexes directing the query to a specific set of rows and help identify trends in database performance by creating an archive of performance data for comparison and analysis.
- Write query throughput and performance: Monitoring PostgreSQL queries writing changes to the database is crucial—not only because the inability to efficiently update a database can quickly cause issues, but also because changes in write query throughput are often signs of other database issues. PostgreSQL monitoring should track the number of rows deleted, inserted, or updated to help provide a deeper understanding of the types of write queries being sent to your databases. Monitoring write throughput is key for maintaining database health and availability.
- Replication and reliability: PostgreSQL writes query update information by recording transactions in the WALs. The database systems then commit the WAL to disk rather than the updated database page or block—a process providing data reliability and integrity (in case the master database fails, for instance) without notable sacrifices in database performance. PostgreSQL replication monitoring is key to ensuring the system is effectively directing queries to read-only standby servers. If your PostgreSQL deployment is running asynchronous replication, replication delay is also an important metric to monitor.
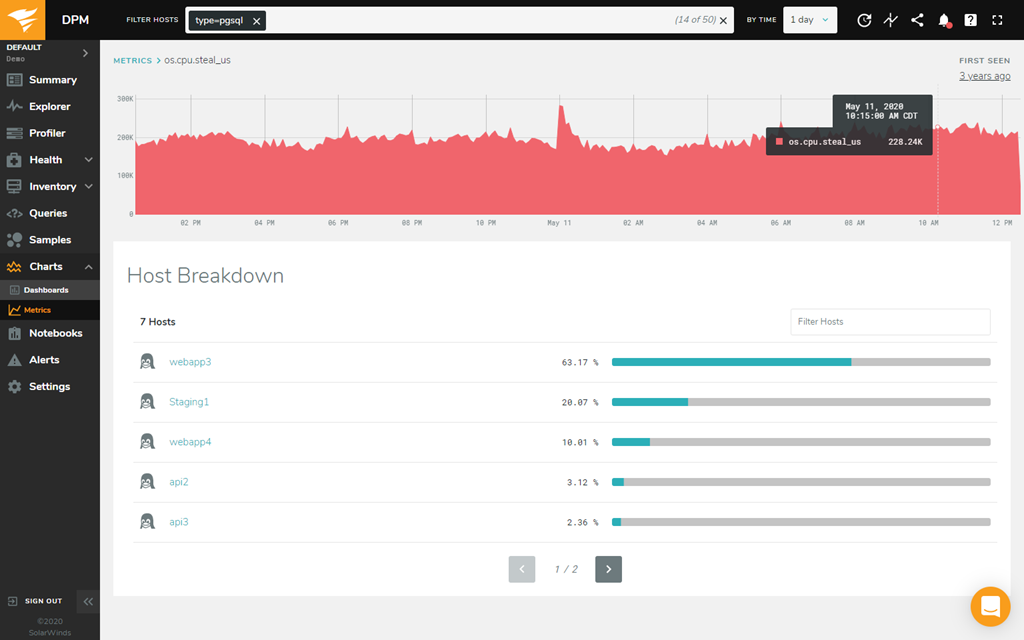
- Resource utilization: Like all databases, PostgreSQL relies on system infrastructure and resources to operate. PostgreSQL monitoring also needs to track how the database uses CPU, disk space, memory, bandwidth, and other common system resources to ensure it can respond to read and write queries efficiently.
Screenshots:
What is a PostgreSQL database?
PostgreSQL is an open-source, object-relational database popular for its reliability, data integrity, and extensibility. Features like write-ahead logs (WALs) and Multi-Version Concurrency Control (MVCC) help make PostgreSQL highly useful for application developers and administrators alike.
PostgreSQL uses built-in replication—both synchronous and asynchronous—to manage database traffic more effectively. For this reason, it’s recommended to have an effective PostgreSQL performance monitoring solution. The MVCC function also uses various lock modes to manage concurrent access to database tables, which makes PostgreSQL lock monitoring necessary, as well.
How to monitor PostgreSQL database performance
PostgreSQL includes a statistics collector and Postgres activity monitor. The statistics collector provides some Postgres performance monitoring capabilities and can automatically collect and organize certain database performance metrics (monitoring for some metrics can also be enabled manually).
However, using database monitoring software designed to increase system performance, team efficiency, and infrastructure cost savings can help you improve PostgreSQL activity along with your overall infrastructure by providing fuller visibility into major open-source databases. Postgres database monitoring tools capable of providing not only granular visibility but also a unified performance view across database types can help support the kinds of powerful analysis and deep insights to improve problem resolution time.
How does PostgreSQL monitoring work in DPM?
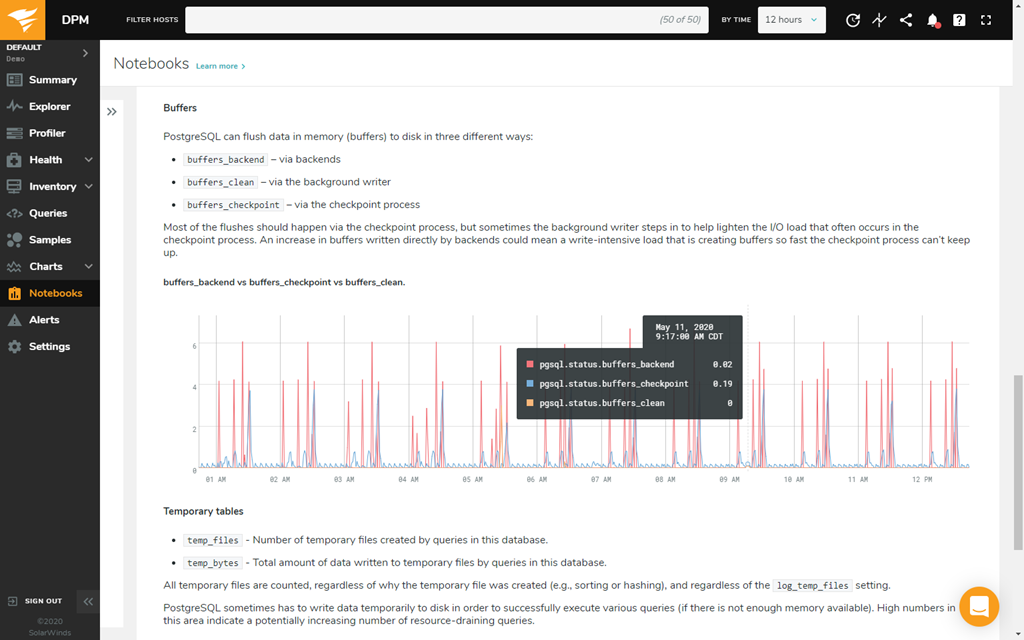
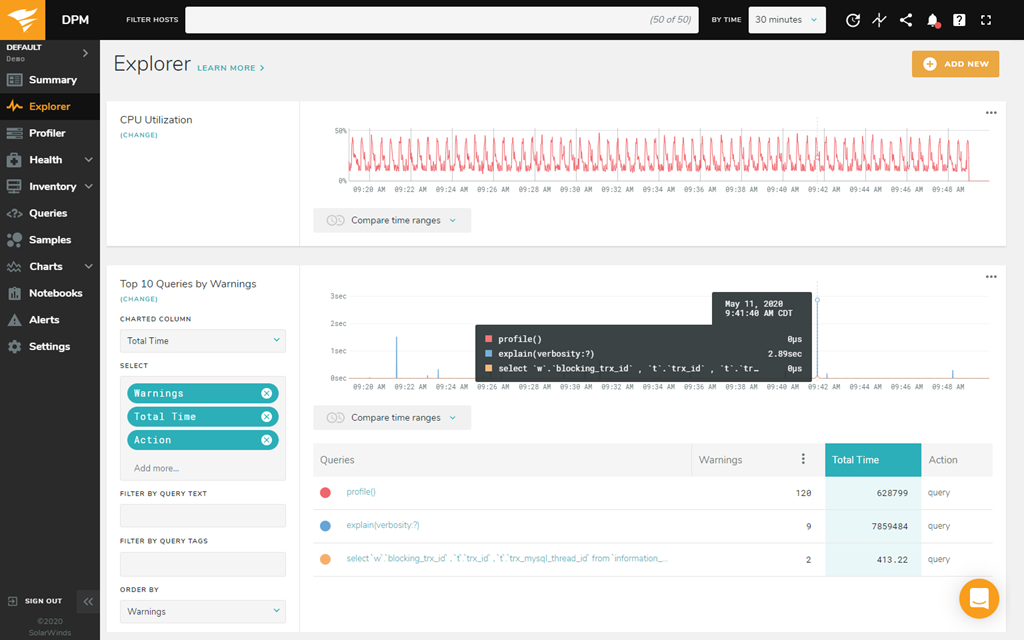
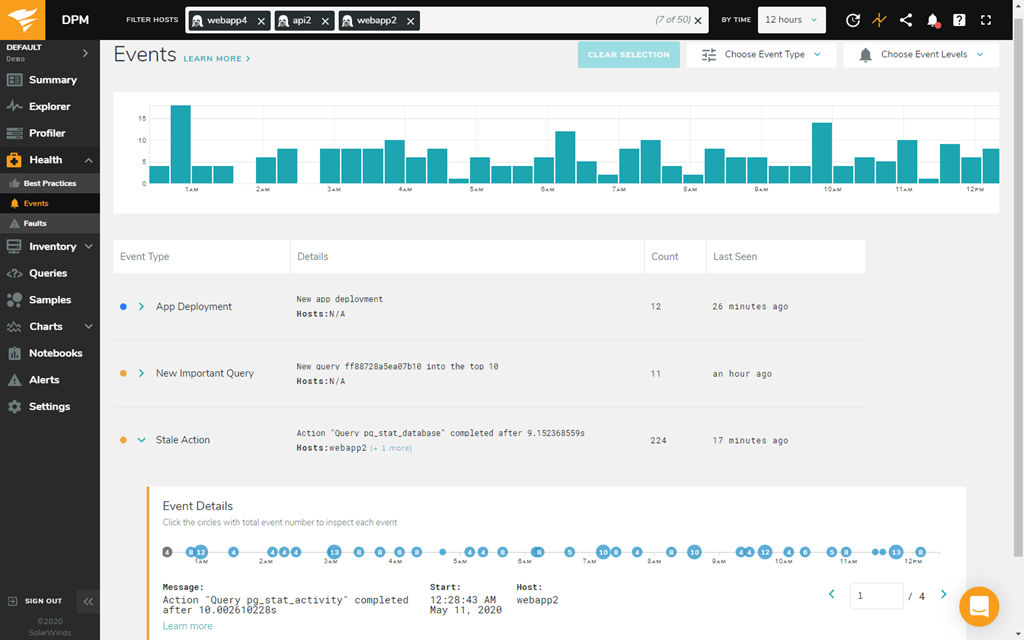
DPM includes Postgres performance monitoring tools built to provide crucial visibility into the operations of databases and systems. The PSQL monitor function in DPM can collect detailed information for thousands of metrics across your deployment with one-second resolution, with intuitive, customizable dashboards allowing you to examine your database workload holistically—and drill down to the granular detail easier.
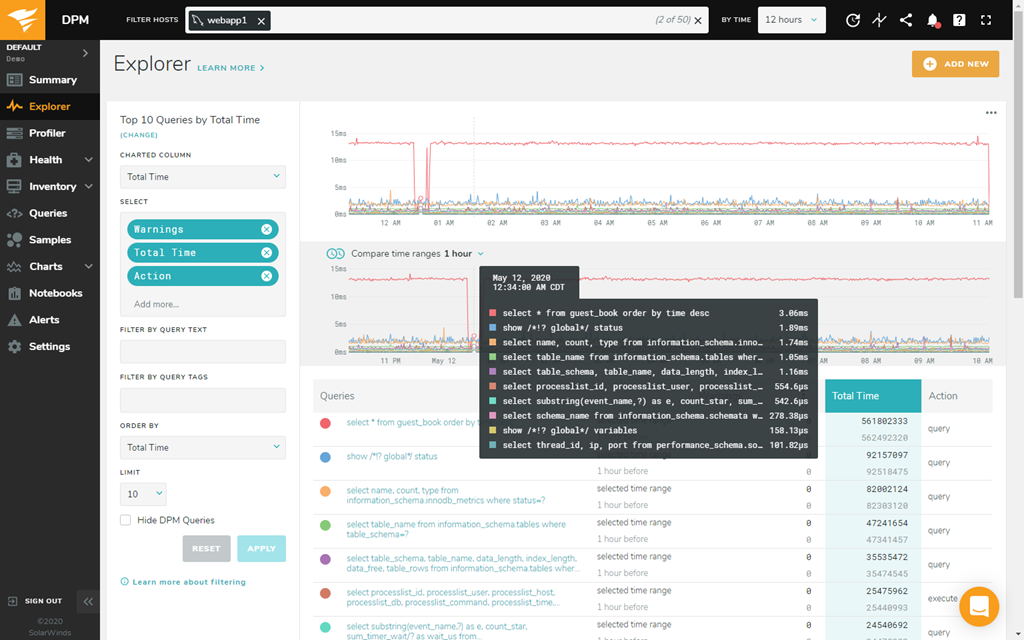
Features like Top Queries are designed to show a master-detail view across servers, with per-second drill-down into samples of queries, EXPLAIN plans, and cross-correlations with other metrics like I/O and CPU. You can also thin-slice queries, users, and databases, and compare across time periods quickly for before-and-after change analysis. DPM also uses powerful analytics to achieve faster, more accurate troubleshooting, which can help speed up time to resolution.
Documentation:
Download the Solarwinds Database Performance Monitor Datasheet (.PDF)
Get in touch with a Solarwinds Solutions Specialist today to Learn More!

