
Solarwinds MySQL Performance Monitoring Tool
Measure MySQL queries, processes, and metrics
Overview - Database Performance Monitor:
Open-Source Database Performance Monitoring
Database Performance Monitor (DPM) provides deep database performance monitoring at scale, without overhead. Our SaaS-based platform helps increase system performance, team efficiency, and infrastructure cost savings by offering full visibility into major open-source databases including MySQL, PostgreSQL, MongoDB, Amazon Aurora, and Redis.
Features Overview
- 24/7 monitoring, for both real-time and historical analysis
- One-second granularity helps you spot and diagnose small performance issues
- Compare queries, databases, and more with custom side-by-side views
- Comprehensive database performance analytics include query samples and explain plans
- Weekly and daily summary reports and customizable alerts
- Unified view of all your database types and servers to understand your system
- Meaningful summaries show you golden signals of service quality and health for database and system performance
Database Support
Features - MySQL Performance Monitoring Tool:
Monitor and optimize MySQL queries with powerful tools
Visualize the performance data you need to pinpoint MySQL performance issues by using SolarWinds® Database Performance Monitor (DPM). DPM includes MySQL performance monitoring capabilities designed to measure latency, throughput, errors, warnings, index usage, execution plans, and more—for every query that executes, in microsecond resolution. Built for IT professionals, DPM provides tools to enable you to examine your system globally and to instantly drill down to individual problem queries on specific servers.
Examine detailed MySQL database performance metrics
DPM is built to monitor a broad set of metrics from your system, collecting and categorizing multi-dimensional data on every query and user, as well as system components like databases, processes, disks, CPUs, and more. DPM can capture over 10,000 metrics every second from every system it monitors—well beyond the standard counters and metrics exposed by MySQL. The combination of down-to-the-second data collection and granular detail helps provide the insights needed to efficiently and quickly solve performance problems.
Use flexible and efficient cloud-based MySQL monitoring solutions
DPM is a SaaS MySQL monitoring solution built to help you save money on provisioning and maintenance costs while automatically offering access to new features and capabilities as SolarWinds deploys them.
DPM’s agent auto-discovers your systems, then installs quickly. These agents are completely passive, using techniques such as network traffic capture and inspection of system views, and provide safe data encryption in-flight and at-rest, with no inbound network access required. The agents are built to be highly efficient and resource constrained, using less than 1 percent of CPU.
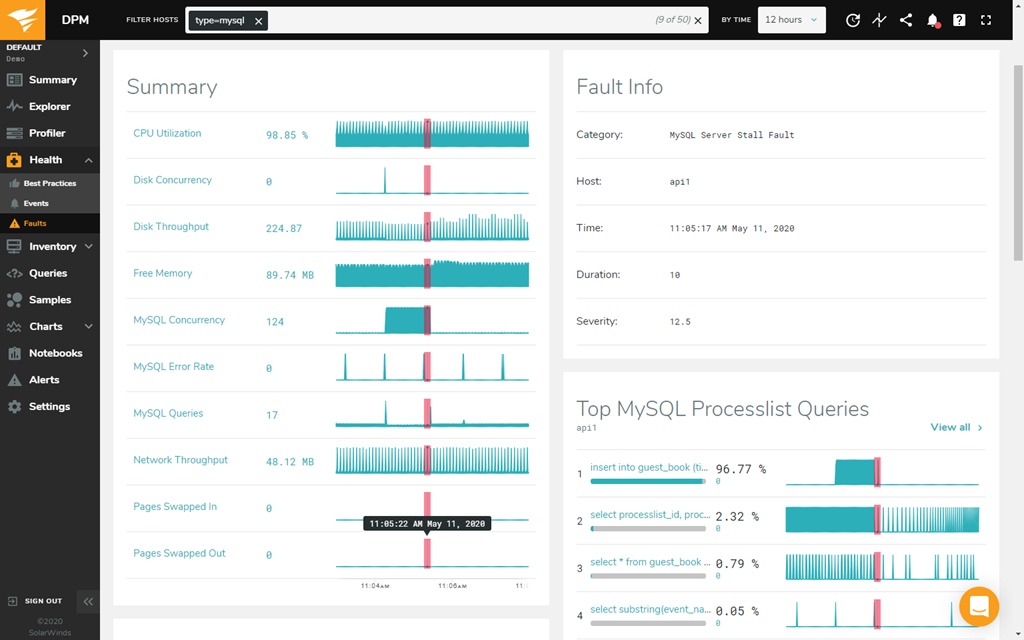
Leverage fault detection and analysis to reduce resolution times
DPM uses adaptive fault detection and big data analytics to help provide valuable insights into your database and system performance. DPM’s analytics platform uses advanced techniques such as regression analysis and queueing theory to deliver insight into the relationship between queries and system resources. Adaptive fault detection helps pinpoint small interruptions to server or service availability, including micro-fine server stalls.
Increase collaboration with MySQL performance monitoring tools designed for cross-functional teams
Database performance can impact all parts of an organization, so it’s essential to have all your application developers, DevOps, and administrators on the same page when it comes to supporting business-critical operations. DPM makes problem-solving easier. Chat, deep-linking, quick sharing, and other features allow teams to share updates efficiently, and can be used to catch problems while still in the development and staging phases. Discover how this powerful and intuitive monitoring tool can help your team analyze query and server behavior from development to deployment.
Key Benefits:
- Visualize thousands of collected metrics across thousands of databases with simple-to-create and -share charts
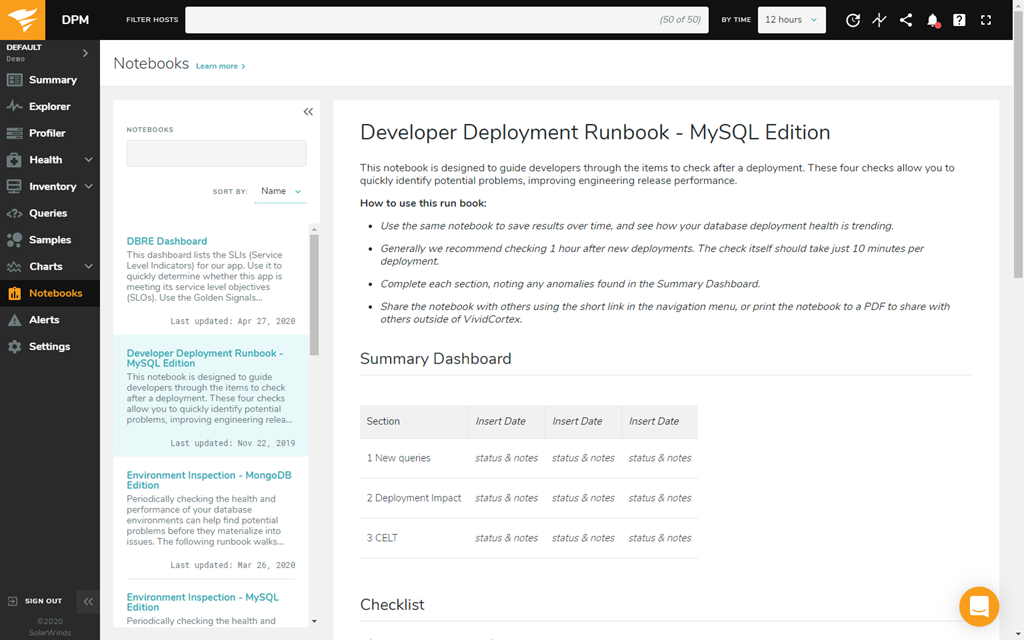
- Cross-functional team workflow is facilitated with notebooks to create and share knowledge
- Optimize resources and reduce database incidents with one-second resolution into workloads
- Ship better code
- See query response before and after a deployment event
- Examine query details and performance including samples and execution plans
- Compare the performance of your top queries over time
- Troubleshoot and diagnose outages
- Correlate query response or behavior to system metrics to understand impacts
- Isolate unusual behavior and potential contributing factors within the database
- Understand database health
- Track metrics and watch for trends with health summary for databases and systems
- Get recommendations based on best practices
- Explore and examine performance outliers
Details:
- Support for physical, virtual, and cloud-based databases, including AWS RDS
- Architecture
- Secure, cloud-hosted platform
- In-flight and at-rest encryption
- Role-based access control, single sign-on, and SAML integration
- Configurable option to filter customer sensitive data
- Built on the International ISO/IEC 27000 family of standards
- GDPR compliant along with SOC 2 Type II certification
- Alerting and integration module allows for injection warnings to be transmitted directly to email, Slack, Victorops, or any number of messaging systems
MySQL key performance statistics
Changes in database speed and performance have wide-reaching impacts across entire companies. A MySQL performance monitor tool can collect a huge number of performance metrics exposed by MySQL databases, and by focusing on a few key metrics, you gain a deeper understanding of your system performance and how to improve it. Comprehensive MySQL monitoring should focus on four primary areas to help keep databases operating smoothly:
- Query throughput. The efficiency of a system can be an important indicator of database health and performance, and monitoring MySQL queries can provide valuable insight into how databases are processing and responding to requests. While the number of queries will fluctuate over the course of the day, sudden changes in query volume are often the sign of a serious issue. The Questions counter in the built-in MySQL monitor provides a user-friendly view of all statements received by client applications, and examining read and write commands can shed a light on potential bottlenecks and problem areas.
- Query latency. Query latency, or execution performance, is also important to track, because small changes in database latency can have large impacts on resource utilization and performance. The innate MySQL monitor includes a Slow_queries metric, which counts the number of times the run time of a database query exceeds the baseline performance threshold. If average latency is beginning to increase, it could be a sign of resource constraints, changes in client query patterns, or database inefficiencies. Further, sudden increases in the number of query errors reported by the MySQL monitor are typically a sign of a larger problem within the database or with the client-side application.
- Connections. Databases support a limited number of client connections. Once all connections are in use, they’ll refuse new ones, which can impede important client transactions and impact the company’s bottom line. Monitoring the number of client connections is crucial to ensure your systems have sufficient capacity. The Threads_connected metric and configured connection limit are two numbers to keep an eye on.
- Buffer pool usage. When caching data for database tables and indexes, MySQL uses a storage engine, InnoDB, to access a part of system memory called the buffer pool. While monitoring performance metrics helps detect issues when they occur, monitoring resource metrics like buffer pool usage can be useful when moving from the detection to investigation stages of troubleshooting. If database performance is beginning to suffer at the same time the disk I/O is increasing, it can indicate the size of the buffer pool resources need to be expanded.
Screenshots:
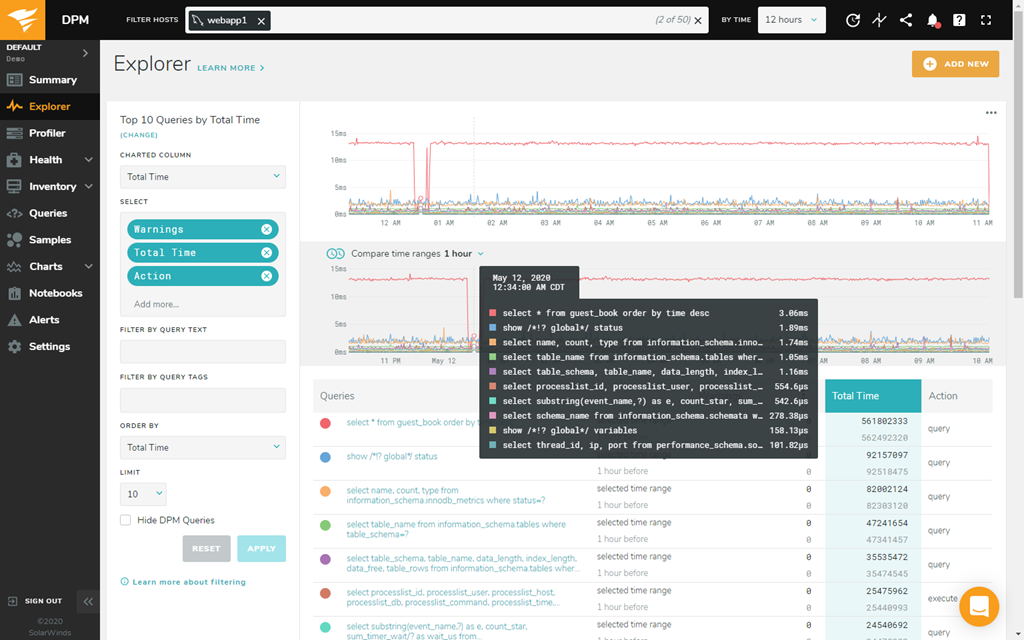
DEPLOY CODE WITH CONFIDENCE
Compare query and system performance with before and after charts, and quickly search for newly introduced queries
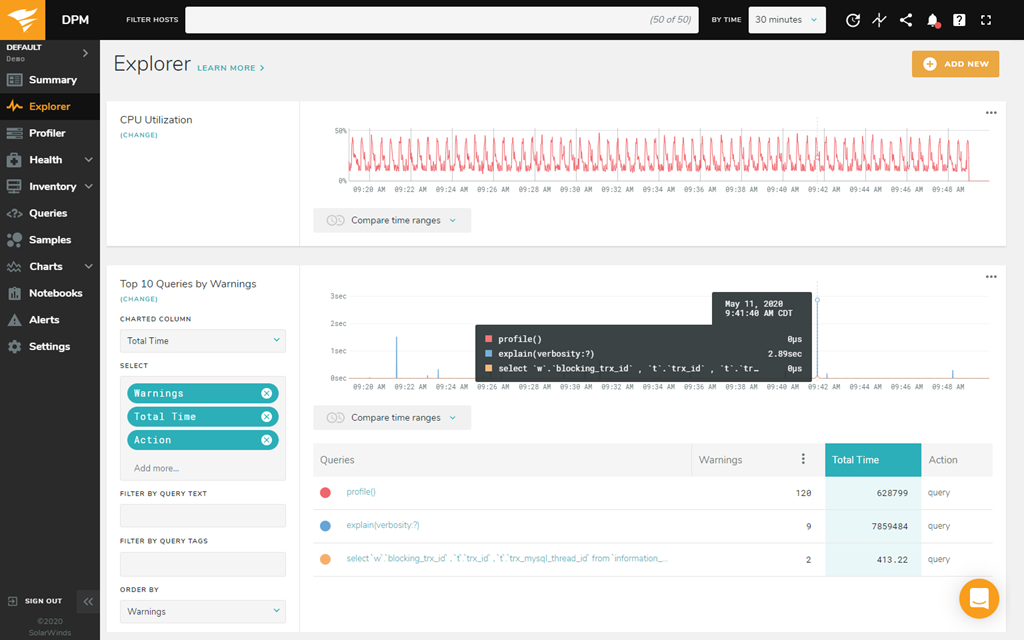
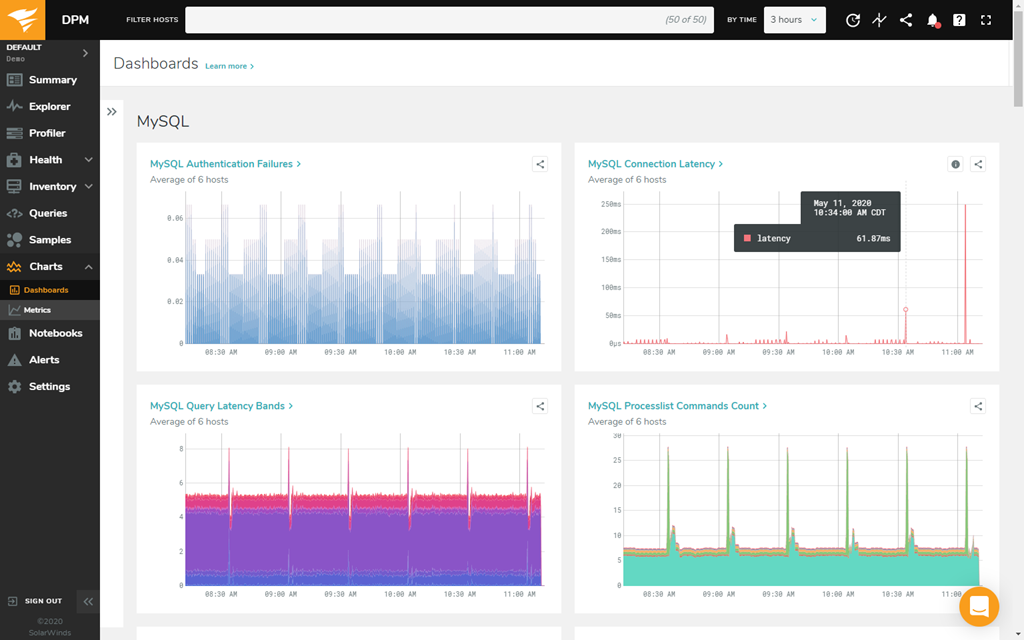
TROUBLESHOOT AND DIAGNOSE PERFORMANCE ISSUES
Visualize and correlate query behavior to system metrics to help troubleshoot performance issues and impact
What is MySQL database?
MySQL databases are among the most popular open-source relational database management system (RDBMS). RDBMSs are useful because they can store different types of data in related tables, which provides a structure for how data is organized and searched. “SQL” is an abbreviation for “Structured Query Language,” a programming language that enables data to be created, retrieved, and modified from RDBMSs, in addition to limiting user access to the database.
In addition to functioning as a database server, MySQL has other administrative applications. It can, for instance, be used to integrate with operating systems to organize workstation storage into relational databases, provide network access, manage user accounts, help create backups, and test database integrity. RDBMSs like MySQL are commonly used for storing large amounts of data—including complex financial, personnel, and manufacturing information—and are popular for their ease of implementation and use as compared to legacy systems like hierarchical and network databases.
Why should I monitor MySQL?
Many businesses and organizations rely on the power and versatility MySQL systems provide to run their websites and storage systems. For instance, databases like MySQL are the backbone of e-commerce sites, running multiple tasks and processes to ensure business-critical web applications are operating optimally.
A robust MySQL performance monitoring tool is necessary to track and manage the health of vital infrastructure systems and can often provide valuable MySQL query statistics and insights to help improve troubleshooting times. MySQL database performance metrics can reveal underlying resource or system issues that have otherwise gone undetected, and MySQL query monitoring tools can help to pinpoint the exact requests causing issues. MySQL monitoring tools offer necessary visibility into your systems, so you can understand precisely how to start fixing problems as they arise.
How to view MySQL performance?
While MySQL’s built-in monitor is useful for ad hoc performance checks and query tuning, many of the metrics exposed by MySQL database can be accessed programmatically and routinely. Therefore, the most efficient way to view MySQL performance is by adopting a robust MySQL performance monitoring tool. These software solutions integrate with MySQL systems to collect application- and system-level metrics, cross-examine metrics from different systems, and help investigate the root cause of performance issues.
The best MySQL performance monitors include powerful graphic and visualization capabilities to provide an at-a-glance understanding of performance and resources, which also contributes to speeding resolution time. Leading MySQL monitors and monitoring platforms also include alerting systems to notify admins when key metrics approach and cross critical performance thresholds.
While recently changed queries are often the cause of performance issues, this isn’t true in all instances. MySQL monitors are necessary tools for investigating query issues and resource constraints, and for keeping your systems operating smoothly.
A MySQL performance monitoring tool can also help manage buffer pool usage. By default, buffer pools are small (set at 128 MiB), but on database servers, the majority of physical memory—MySQL advises as high as 80 percent—can be dedicated to buffer pools. However, it’s important to remember memory overhead can actually increase overall memory footprint beyond the allocated buffer pool resources—so running out of physical memory will cause database performance to suffer dramatically. Tracking metrics like buffer pool size, utilization, and efficiency can be useful for ensuring systems are adequately provisioned and secure.
How do the MySQL monitoring tools in DPM work?
A MySQL monitor like SolarWinds Database Performance Manager (DPM) provides a comprehensive set of tools for database admins.
DPM’s MySQL monitoring tools collect exposed MySQL database performance metrics and organize them into preconfigured dashboards designed to get you monitoring the most important metrics right out of the box. This allows you to track thousands of distinct metrics about your applications, databases, and infrastructure and to organize and filter those metrics, so they can be examined and analyzed. Clicking on a metric in a table, for instance, will bring you to a more detailed breakdown for the metric, including performance over time and host relationships.
DPM also allows you to create customized dashboards with the click of a button, which can be especially useful when correlating metrics from different systems and further enables you to tailor your MySQL monitoring to the specific needs of your deployment.
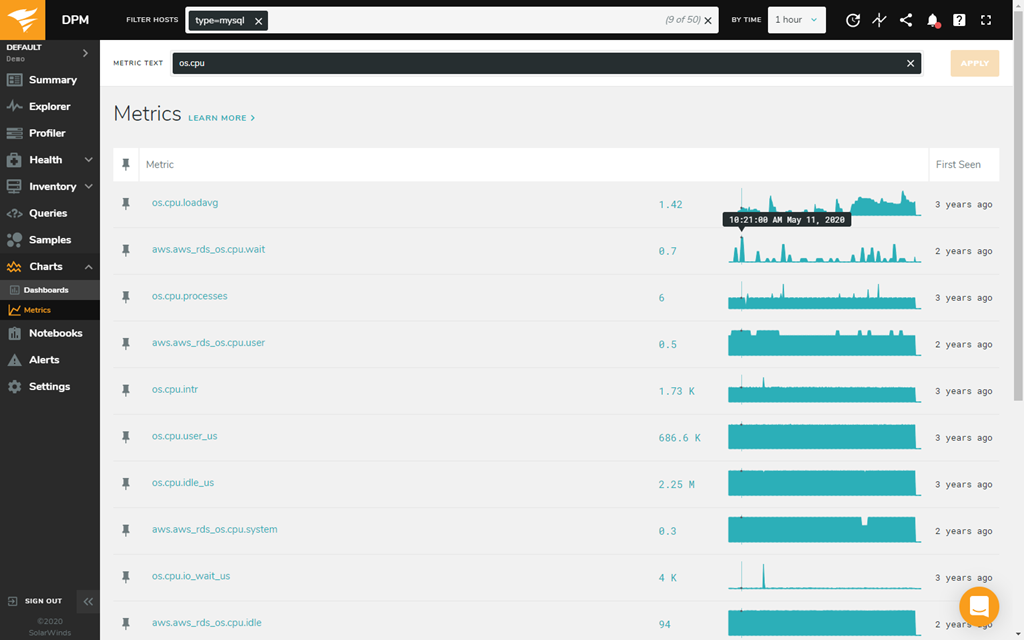
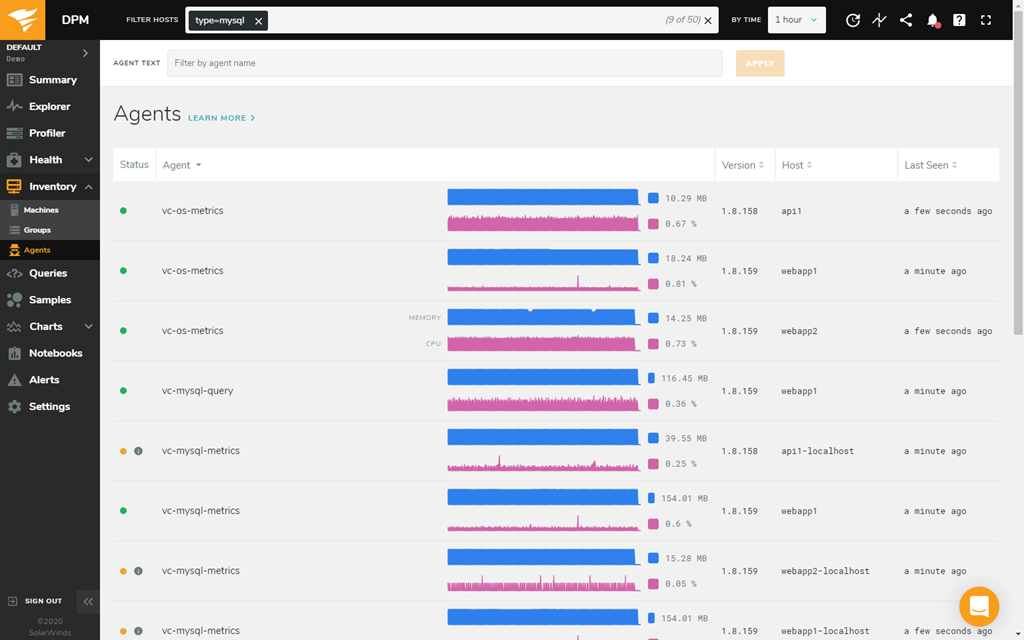
In DPM, the Metrics page displays measurements taken from individual exposed metrics, while also allowing you to filter and sort the results by specific metric names and hosts. DPM collects information about MySQL database performance metrics with one-second granularity, which the tool uses to construct detailed historical archives of performance data that can be analyzed and dissected for deeper understandings.
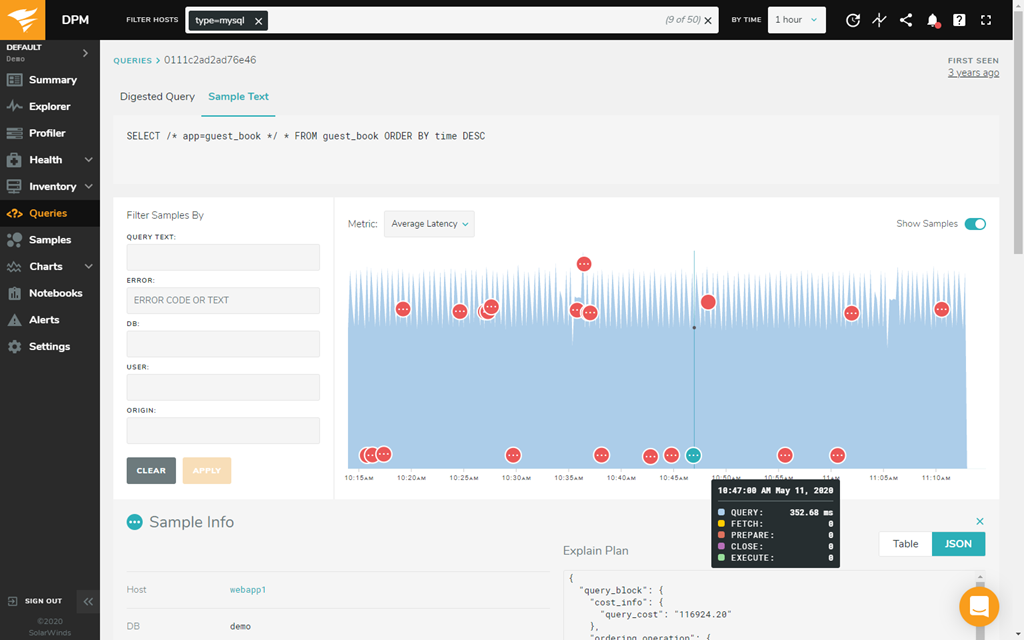
DPM also collects information about database queries and can assist in database optimization and query tuning operations. The software is designed to make data convenient and usable to you, allowing you to sort through queries by category—such as those reporting errors, missing indexes, or slow response times—or by when the query first appeared. Features like Top Queries show a master-detail view across servers in your application, with per-second drill-down into samples of queries, EXPLAIN plans, and cross-correlations with other metrics like I/O and CPU. You can thin-slice queries, users, and databases, and compare across time periods quickly for before-and-after change analysis.
Lastly, DPM’s MySQL monitor includes robust graphs and visualizations. If you have dashboard systems you already prefer, there’s no need to worry—DPM’s set of MySQL monitoring functions and capabilities can integrate via a free downloadable plugin with a variety of open-source analytics and visualization solutions, including Grafana. With this, you can access the thousands of metrics DPM helps to monitor and manage, but from the familiarity of the same dashboard your teams know and recognize.
Documentation:
Download the Solarwinds Database Performance Monitor Datasheet (.PDF)
Get in touch with a Solarwinds Solutions Specialist today to Learn More!