Solarwinds Pingdom
Cloud-hosted log management for faster troubleshooting of infrastructure and application issues
Overview:
Your website is the face of your company. Every time it’s down or running slow, there’s a direct impact on the business, either in lost productivity or lost customers, and, as a result, lost revenue. The challenge is you can’t fix what you’re not aware of, and you need to find out about the issues quickly because if your customers find out first, it’s game over. For today’s web-scale application environments, it’s not just about the web application’s availability; it’s about the performance and resulting end user’s experience. You need to know right down to the transaction level if your application is available and performing as designed. You need to monitor user interactions and business transactions to provide actionable insights because when availability and performance issues arise, they need to be fixed quickly—before the customer feels the impact.
SolarWinds Pingdom is a powerful and affordable SaaS-based web app performance monitoring solution, combining synthetic and real user monitoring (RUM) for ultimate visibility and enhanced troubleshooting in a single pane of glass.
Synthetic Monitoring
Simulate visitor interaction with your site or web app to know if and when critical pages or flows stop working correctly. Synthetic monitoring features:
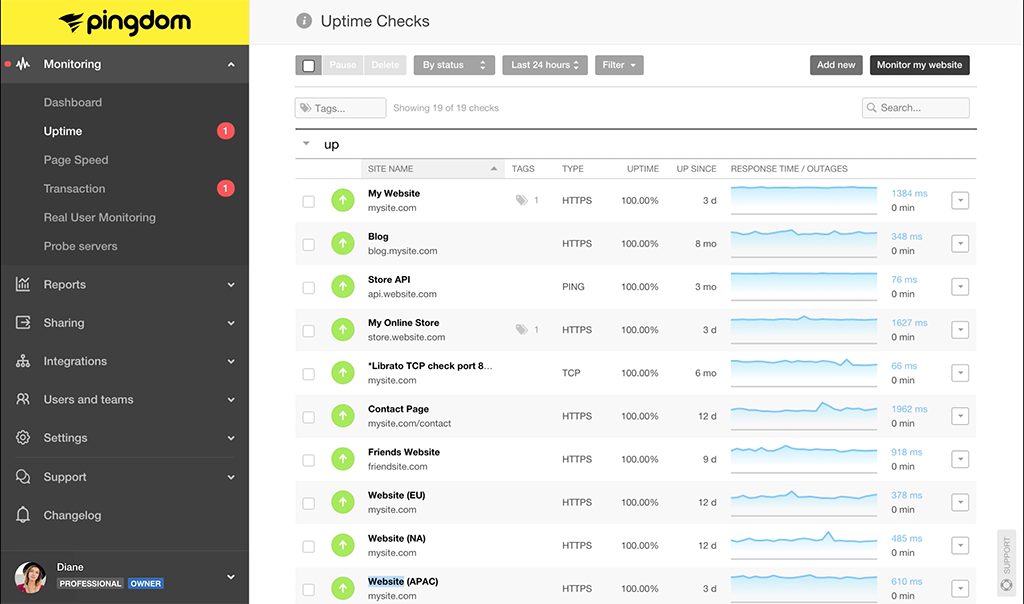
- Uptime monitoring: monitor site availability from over 100 locations worldwide.
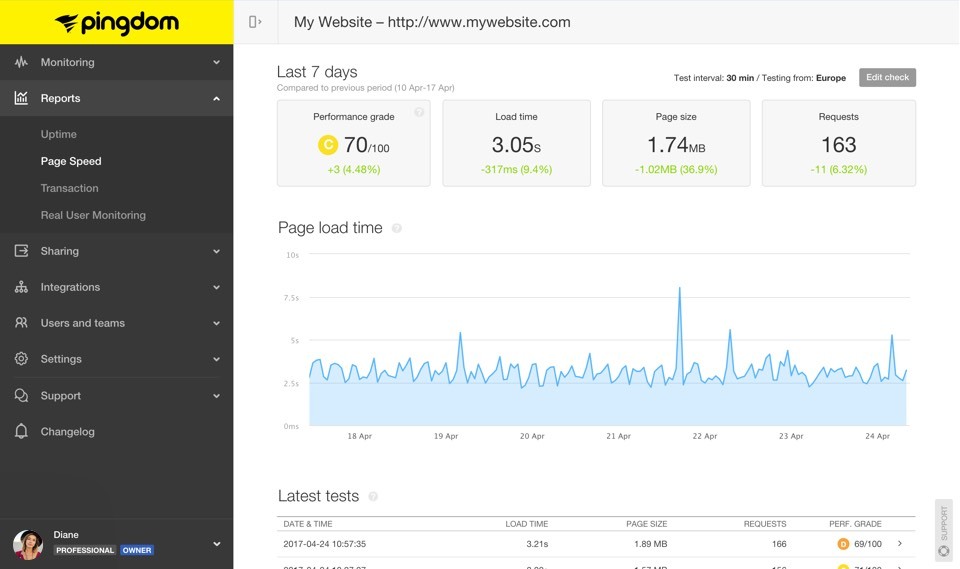
- Page speed analysis: know when and why your website is slow to help you troubleshoot fast and provide the best service to customers.
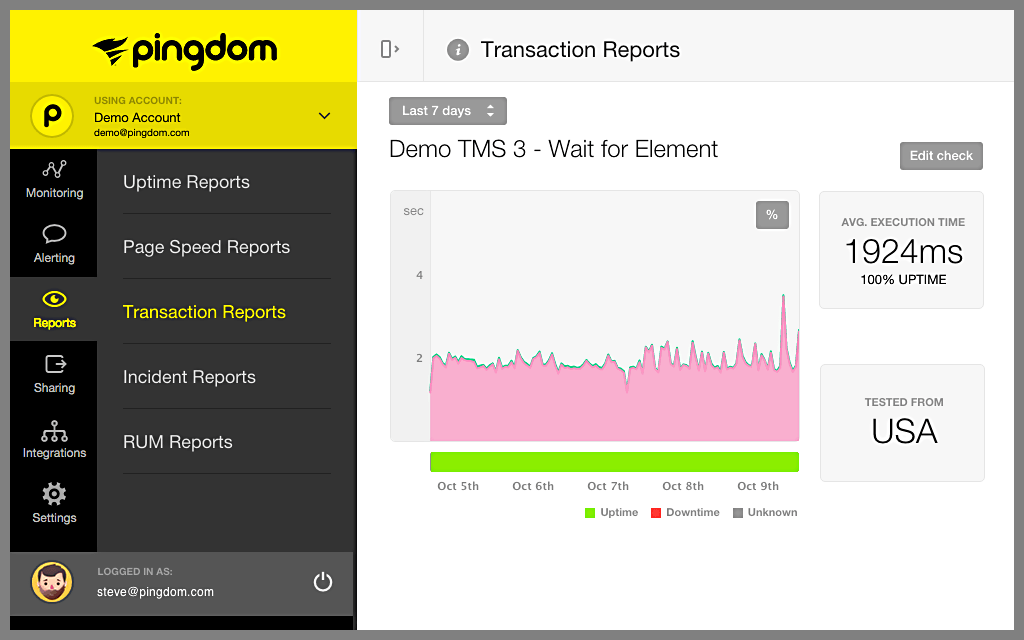
- Transaction monitoring: test simple or highly complex transactions, such as new user registrations, user login, search, shopping cart checkout, URL hijacking, and more
Real User Monitoring
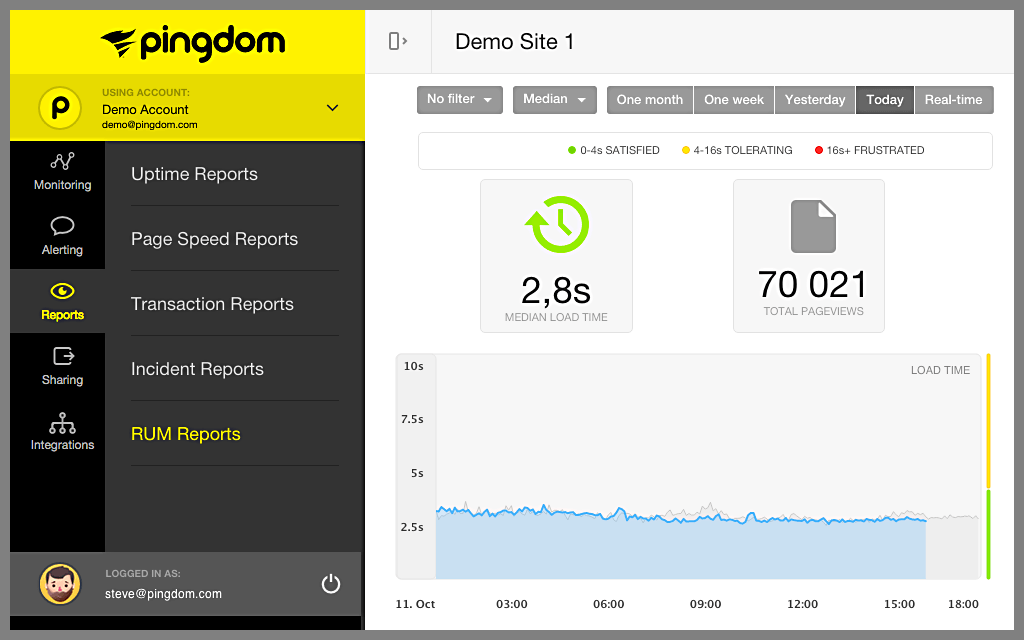
Gain visibility into how actual end users are interacting with and experiencing your website with scalable and easy-to-use real user monitoring (RUM). With Pingdom RUM, you can:
- Know how your site or web app is performing with real user insights in real time.
- Understand how your visitors experience your site based on browser, device, and geographic location.
- Compare usage metrics over time to see if your website is performing better than last month, last quarter, or last year.
- Make sure you hit critical KPIs and SLAs by setting your own or using our defaults.
Pingdom At A Glance
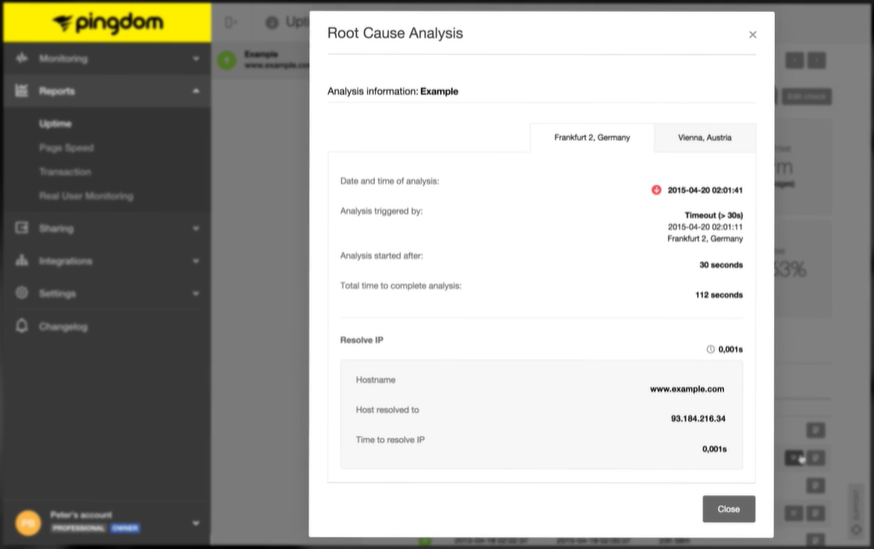
- Help ensure web application availability by proactively monitoring your web applications, APIs, and networks. When your website’s down, you and your team will receive an immediate alert, complemented with a root-cause analysis report and outage details for efficient troubleshooting.
- Maintain critical transactions by measuring and alerting on simple-to-complex multi-step user interactions, such as shopping cart checkout, account login, or item search.
- Monitor performance metrics such as page load speed, number of requests, size, and how it ranks according to Yslow’s performance matrix.
- Optimize for speed with detailed waterfall reporting to identify load times of each element of the page and choke points.
- Identify your key customer groups and see if they’re satisfied with your web applications performance. Correlate web performance with user behavior to see the impact on your revenues.
- Scale with confidence, fulfilling the needs of enterprise-level web applications. Easily manage millions of URLs and large amounts of data.
Features Overview
Pingdom is the trusted industry standard for easy and powerful web performance and digital experience monitoring

Powerful
Solve your most complex website performance and reliability issues.

Unexpected Simplicity
Pingdom is easy to implement, use, and understand. Start increasing your web performance generally in minutes after implementation.

Affordable
Get high quality, reliable monitoring at an affordable price. Several easy-to-understand plans are available to meet your requirements.

Full Stack Monitoring
Pingdom is part of the SolarWinds DevOps solution, which provides full stack monitoring as a service.
Features:
Correlation of your web performance with business outcomes
Correlate performance metrics such as page load speed with the customer behavior like bounce rate. Easily share these data-backed insights with your team and manager, and adapt your digital strategy accordingly.
Exceptional visualizations and reporting
Our shareable business reports are informative for all members of the team, from developers to non-technical managers. With a set of advanced visualization tools like timeline and film strip screenshots, even large amounts of data are presented in an easy-to-understand manner.
Easy-to-create synthetic transactions
The web recorder captures how a user interacts with your website, and translates those actions into a script. Or if you prefer to write the script yourself, our built-in editor suggests likely steps and validations to help you along the way. Set up continuous tests of important transactions like checkouts, form fills, sign ups, and even your authentication process. Monitor all business-critical transactions on your site.
Market-proven, robust, 24/7 web application monitoring
Since 2007, Pingdom has helped ensure your web applications are resilient and monitored non-stop. With an ever-expanding network of 100-plus probe servers worldwide, Pingdom provides you with a highly reliable web monitoring tool.
Reliable, team-oriented alerting
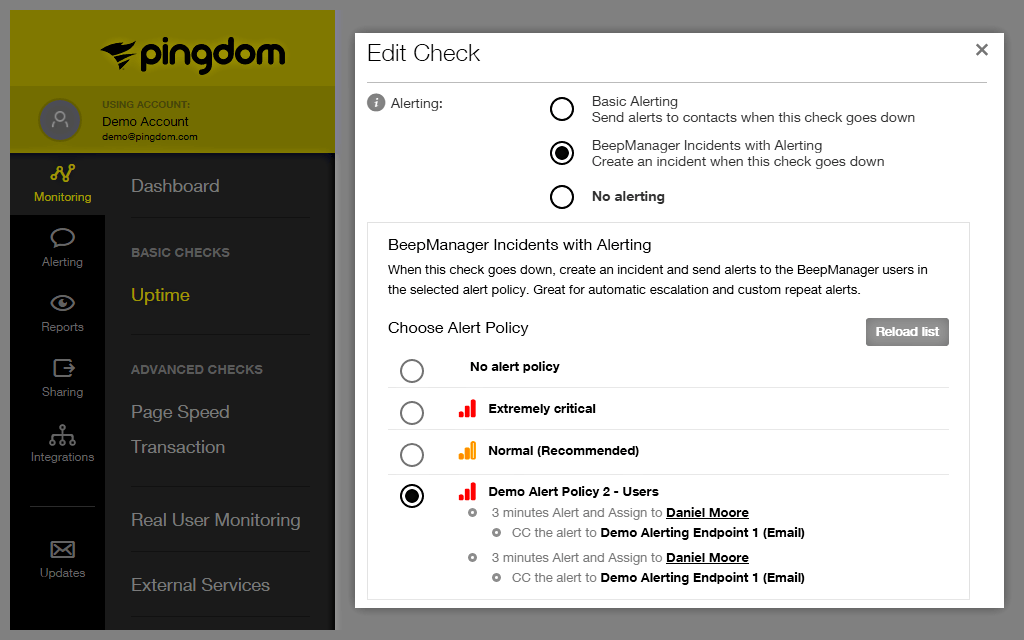
Be the first to know about issues with real-time health and performance alerts, through notifications such as SMS, email, integrations with Slack® , PagerDuty® , Opsgenie® , and much more. You can help ensure everyone who needs to know is alerted and create team groupings to provide different levels of access to Pingdom.
Historical data and trends at a glance
Identify historical trends with page speed performance reports and examine the impact of the changes you’ve made. See up to 13 months of real user monitoring data retention for optimized marketing strategy.
Developer-friendly API
Automate your interaction with the Pingdom synthetic monitoring system and its API. Create your own scripts or applications with most of the functionality you can find inside the Pingdom control panel. Simplify larger deployments with CRUD endpoints, which automate the creation of uptime and transaction checks at scale and in dynamic environments. Create new API queries in minutes with a simplified implementation.
Go deeper to the root cause
Designed for application owners, the SolarWinds application performance management (APM) suite, including Pingdom, client-side; SolarWinds AppOptics™, server-side application and infrastructure monitoring; and SolarWinds Loggly log management and analytics, are a collection of easy-to-use tools that come together to seamlessly provide full-stack availability and performance management of your web applications—without the cost or complexity of traditional APM solutions.
Challenges addressed:
- Ensuring your web application and its key transactions are up and working as designed for all your users, no matter where they are or how they access the application.
- Knowing your web application is performing the way it was designed to with an end-to-end view of the interconnected elements supporting it.
- Knowing who your real visitors are and how your web application is performing for them. Testing your web app in the real world, not the ideal conditions of the data center.
- Be confident your performance monitoring tool can scale with your business technically and cost-effectively.
Screenshots:
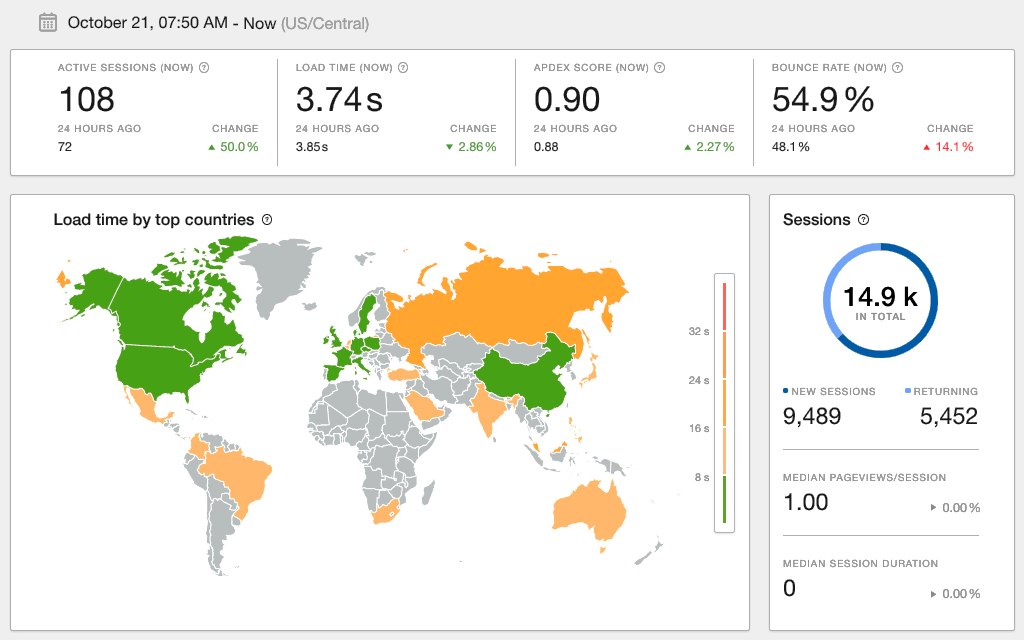
Web application performance from your user’s perspective.
Continuously enhance the user experience of your websites and web applications. Be the first to know when site issues affect your visitor’s experience and get the information needed to quickly resolve issues.
Test your most important transactions.
Make sure important interactions, such as signup, search, or downloadable files, aren’t slow or broken.
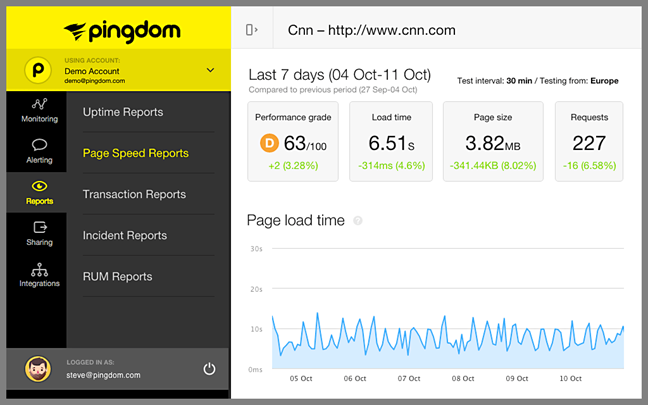
Analyze your websites and make them faster.
Track your website’s load time and find bottlenecks that affect your customers' end-user experience.
Uptime really matters.
Test your website's availability every minute, automatically, with over 60 global polling locations.
Be the first to know.
Receive alerts via SMS, email, and in-app notifications about error messages, HTTP status, content changes, and more.
Troubleshoot and resolve issues quickly.
Discover why a website or server went down, resolve the issue, and prevent recurrences.
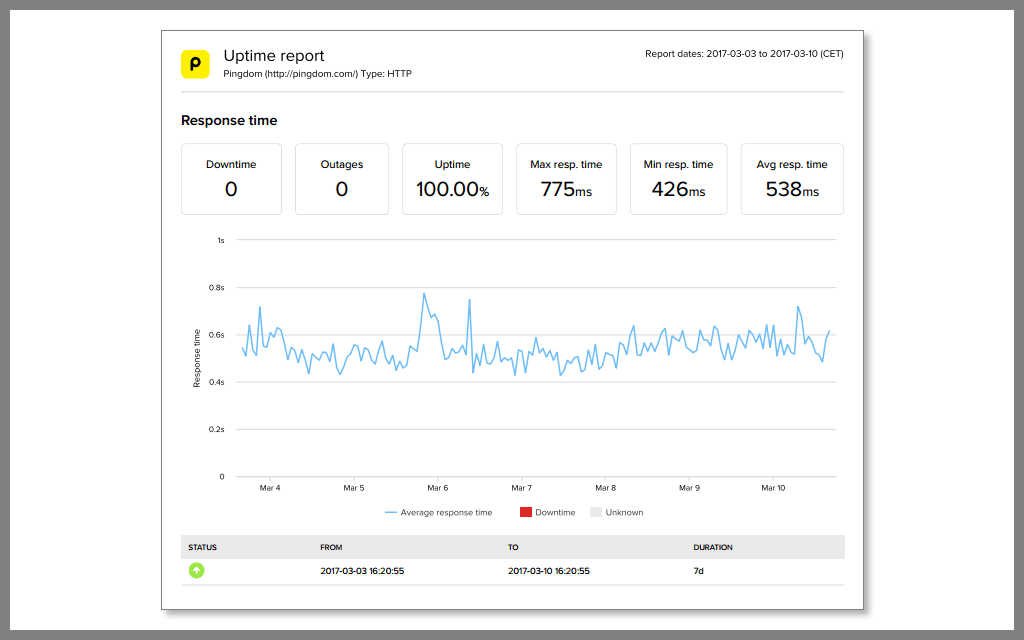
Share the results of your various checks.
Make data-driven decisions based on reports with beautiful graphs that clearly show trends.
Monitor your website from anywhere.
Not at your desk? No problem. Stay up-to-date with apps available for your Android™ or iOS devices.
Application performance visibility regardless of platform.
Proactive web application performance visibility across on-premises, hybrid, Azure, AWS, and other cloud environments.
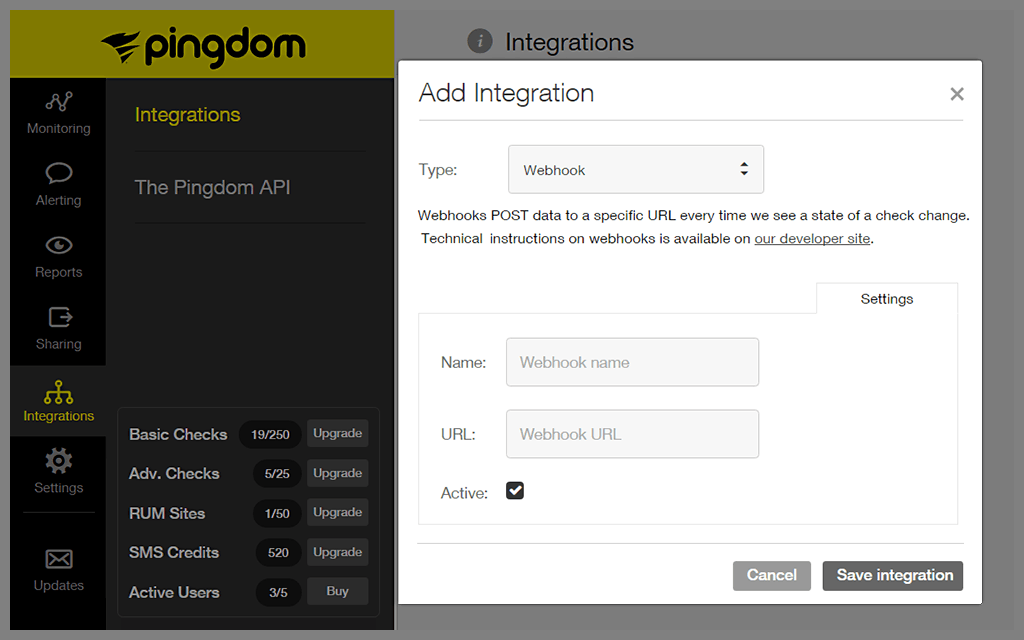
Programmatically act on state changes.
Use webhooks to integrate Pingdom with popular software, including PagerDuty, HipChat, Slack, and others.
Documentation:
Download the Solarwinds Pingdom Datasheet (.PDF)
Get in touch with a Solarwinds Solutions Specialist today to Learn More!

