
Solarwinds Application Performance Optimization Pack
Full-Stack Application, Database, Virtualization, and Server Performance Optimization
Click here to jump to more pricing!
Overview:
Application Performance Optimization Pack at a Glance
- Get a complete view of performance, uptime, capacity, and resource utilization across the stack
- Monitor and optimize systems, applications, and database performance
- Streamline problem resolution and prevention across systems, database, and development teams
What Does Application Stack Management Bundle Including?
Database Performance Analyzer
Database Performance Analysis - Wait-based analysis to optimize application response time
- Response-time analysis provides visibility into the root cause of application response issues
- Historic analysis and dynamic baselines help you spot tuning problems
- Agentless architecture provides visibility into hundreds of production instances with minimal load
Server & Application Monitor
Expert-level application monitoring and troubleshooting with built-in support for 200+ applications
- CPU, memory, and disk capacity planning helps you monitor and troubleshoot effectively
- One dashboard provides visibility into multi-vendor server hardware health and server remediation
- 200+ applications, including Cloud and on-premises environments, can be viewed from one source
Features:

Get the visibility and insights you need inside your applications
Pinpoint inefficient code, resource bottlenecks and application performance management issues - all from one view.

Gain in-depth performance analysis and expert advice
Get direct access to multi-dimensional performance analysis and expert tuning advice regardless of skill level.

Monitor physical, cloud, virtualized, and hybrid environments
Manage and optimize applications on-premise, on virtualized servers, or on AWS or Azure cloud environments from one dashboard.

Extend your platform for deeper insights
Extend your single pane-of-glass to manage and monitor your storage, virtualization, and network performance.

Resolve problems and identify root causes faster
Find and fix issues with wait-time analytics, performance-to-resource correlation, and tuning advice.

Configure reports and alerts to focus on what really matters
Compare performance baselines over time to help solve problems anywhere in the stack before users experience downtime.

Monitor and optimize infrastructure in an application context
Automatically map relationships between applications and the underlying infrastructure that supports it.

View detailed performance metrics for hundreds of applications
Visualize the performance of 200+ apps, including Microsoft Exchange, Apache Tomcat, Linux, JSON/SOAP web services, and many more.
System Requirements:
| Hardware | Minimum Requirements |
|---|---|
| Memory | 4GB for each SAM and DPA server |
| Hard Drive | DPA - approx. 3GB per monitored instance SAM - 4GB |
| Software | Minimum Requirements |
| Operating System | DPA - Linux/Unix or Windows Server SAM - Windows Server 2003 R2, 2008 R2, 2012, 2012 R2. Microsoft IIS, version 6.5 and higher |
| Supported Instances | Oracle 10g, 11g, 12c (single tenant) SQL Server 2008, 2012, 2014 SAP ASE 15.0x, 15.6, 15.7, 16 DB2 LUW 9.x, 10.1, 10.5 VMware ESXi 4 and above |
| Virtual Machine | DPA - Java VM 1.6 or 1.7 SAM - .NET Framework v3.5 or 4.0 |
| Database | Oracle 10g, 11g, 12c (single tenant) SQL Server 2008, 2012, 2014 |
| Web Console Browser | Microsoft Internet Explorer version 8 or higher with Active Scripting; Firefox version 35 or higher (Toolset Integration is not supported on Firefox); Google Chrome version 39 or higher |
Screenshots:
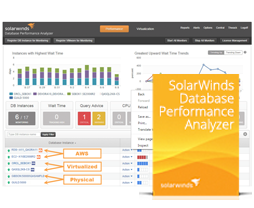
Single pane-of-glass
Get an integrated view of database, systems, and apps
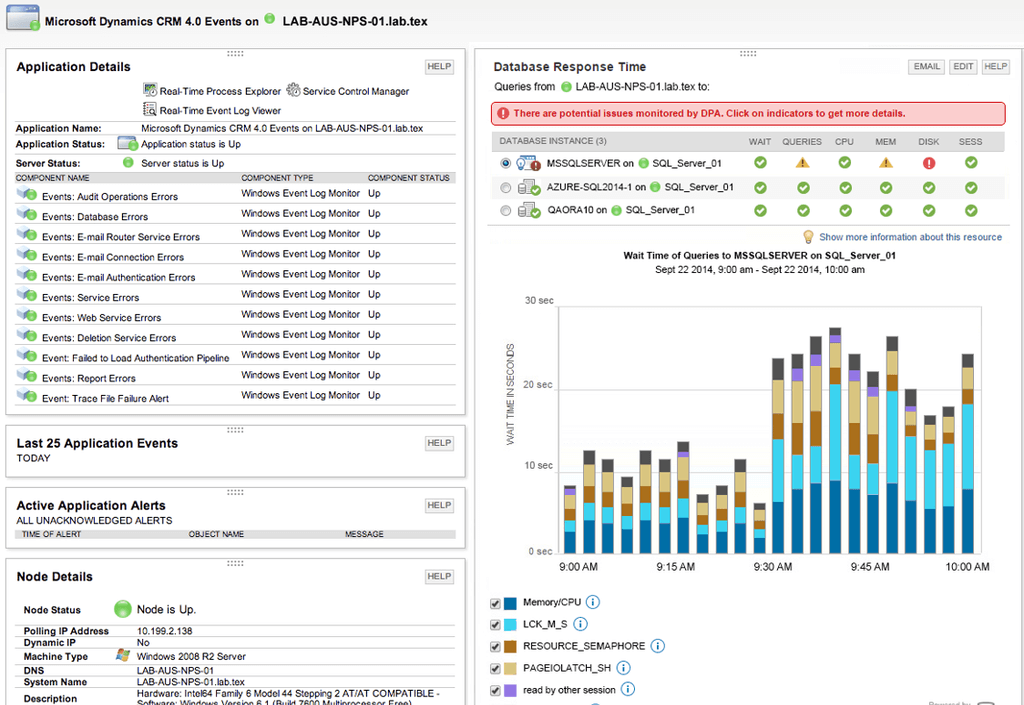
Database impact per specific application
View the impact database performance has on specific applications
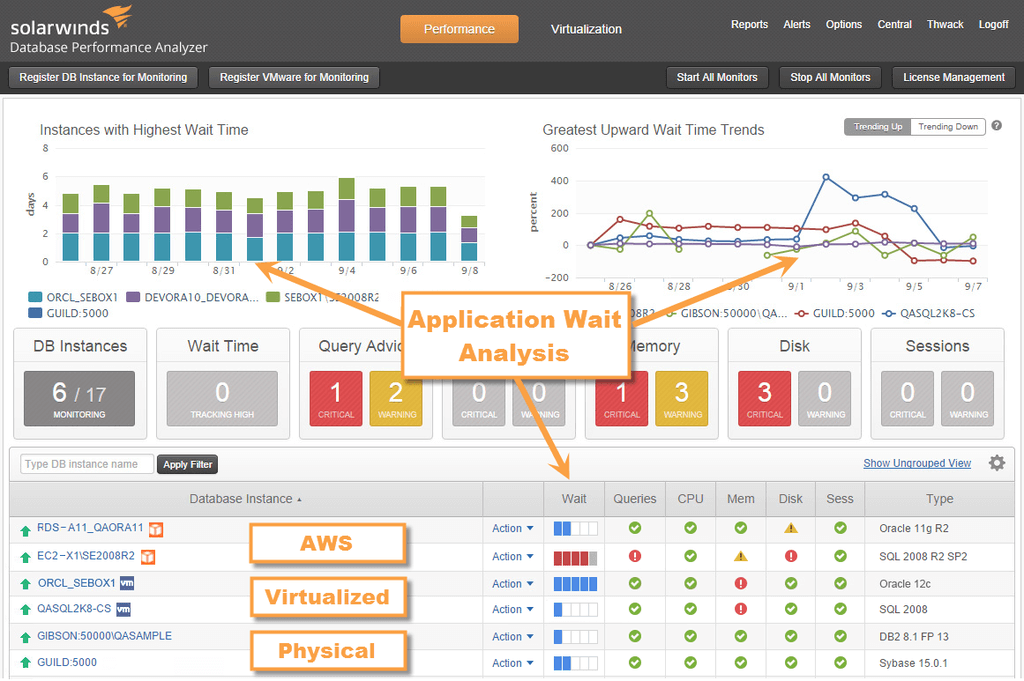
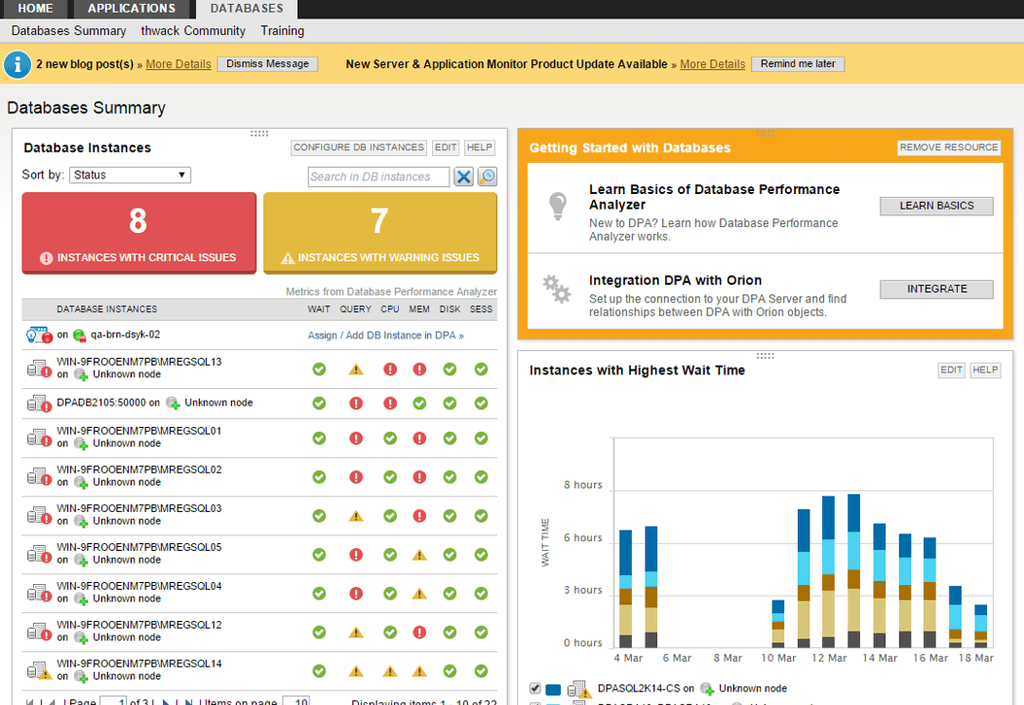
Database Performance Analyzer Dashboard
Identify performance bottlenecks in databases
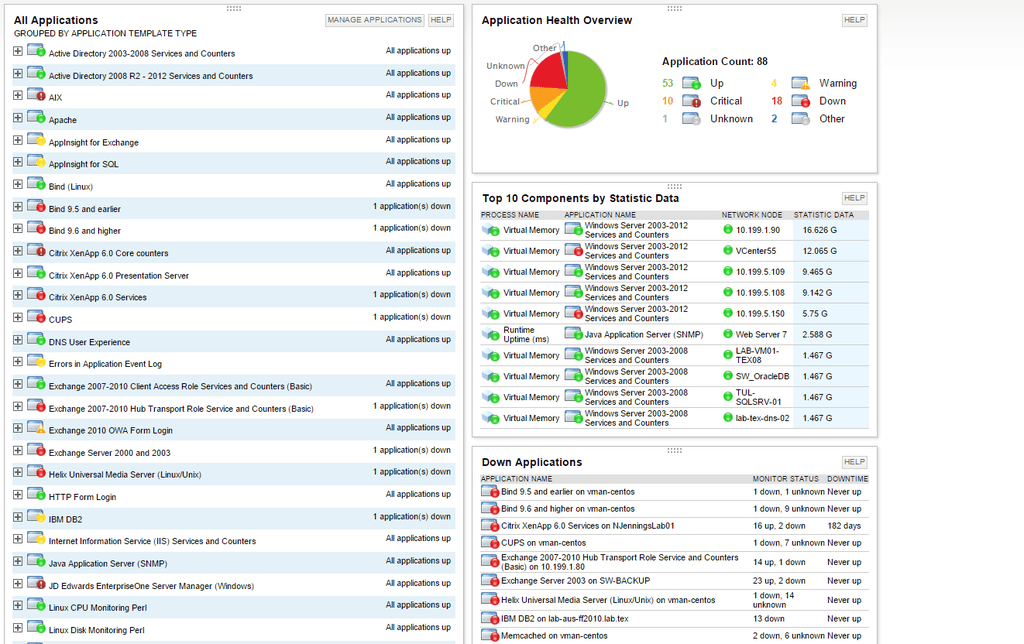
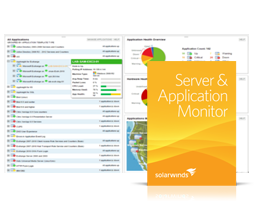
Application monitoring with Server & Application Monitor
Access more than 200+ application-specific monitoring templates
Documentation:
Download the Solarwinds Server & Application Monitor Datasheet (.PDF)