Solarwinds Network Bandwidth Analyzer Pack
Comprehensive Network Bandwidth Analysis and Performance Monitoring
Click here to jump to more pricing!
Overview:
SolarWinds Network Bandwidth Analyzer Pack includes everything you need to monitor network availability, performance, bandwidth, and traffic.
Network Bandwidth Analyzer Pack at a Glance
- Detect, diagnose and resolve network performance issues
- Track response time, availability and uptime of routers, switches and other SNMP-enabled devices
- Analyze and monitor network bandwidth performance and traffic patterns
- Identify bandwidth hogs and see which applications are using the most bandwidth
- Graphically display network performance metrics in real-time via dynamic interactive maps
What Does The Network Bandwidth Analyzer Pack Including?
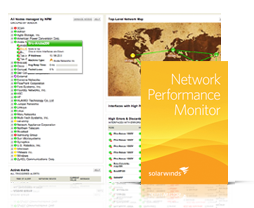
Network Performance Monitor
Fault, availability, and performance monitoring for networks of all sizes
- Monitor and display response time, availability, and performance of network devices
- Detect, diagnose, and resolve performance issues with out-of-the-box dashboards, alerts, and reports
- Graphically display network performance statistics in real time via dynamic, drillable network maps
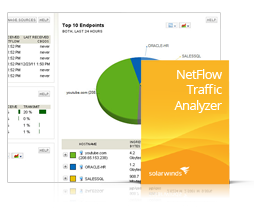
NetFlow Traffic Analyzer
Leverage flow technology for analysis of network bandwidth performance and traffic patterns
- Identify users, applications, and protocols that are consuming bandwidth down to the interface level
- Highlight IP addresses of top talkers and store and display flow data with one minute granularity
- Analyzes Cisco NetFlow, Juniper J-Flow, IPFIX, sFlow, Huawei NetStream and other flow data
Features:

Network fault, availability, and performance monitoring
Monitor network device and interface availability and performance indicators such as bandwidth utilization, packet loss, errors, and more.

Flow based network traffic analysis
Analyzes Cisco NetFlow, Juniper J-Flow, IPFIX, sFlow, Huawei NetStream and other flow data.

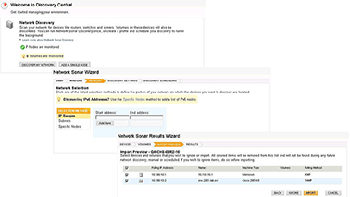
Automated network device discovery
Schedule network scans to identify new network devices and ensure you are monitoring all your critical equipment.

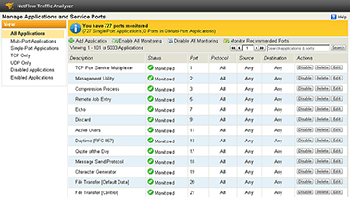
Bandwidth usage by application
Track application traffic arriving from designated ports, source IPs, destination IPs, and protocols with advanced application mapping.

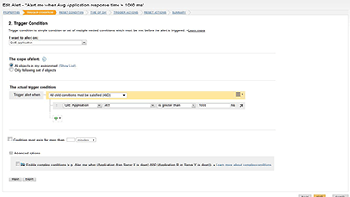
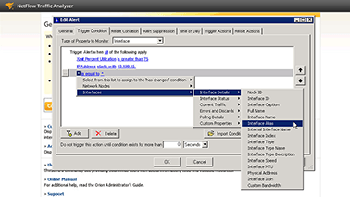
Intelligent topology aware alerting
Configure alerts for correlated events, sustained conditions, and complex combinations of device states.

Bandwidth threshold alerting
Receive instant alert notifications, including a list of “top talkers”, when an interface exceeds its bandwidth utilization threshold.

Deep packet inspection and quality of experience
Identify reductions or changes in application performance and determine if the change is caused by the application or the network.

Multi-vendor device support
Get heterogeneous network support, out-of-the-box, for devices from leading hardware vendors.

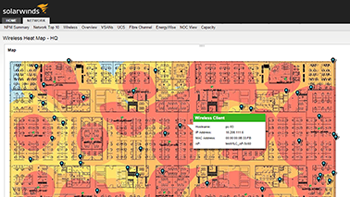
Dynamic customizable network mapping
Drag and drop network devices to customize network maps and view connections and their real-time status and performance metrics.
System Requirements:
| Hardware | Minimum Requirements |
|---|---|
| CPU | Main Poller - 20GB NTA Flow Storage Database - 20GB |
| Memory | Main Poller - 3GB NTA Flow Storage Database - 16GB |
| Hard Drive | Main Poller - Quad Core 3 GHz or better NTA Flow Storage Database - Quad Core 3 GHz or better |
| Software | Minimum Requirements |
| Operating System | Main Poller - Windows 2003 and 2008 Server (64-bit) including R2 with IIS installed NTA Flow Storage Database - Windows 2003 and 2008 Server (64-bit), 2012 R2 |
| .NET Framework | Version 3.5 SP1 and 4.0.3 required |
| Database | Orion Database - SolarWinds supports Express, Standard, or Enterprise versions of the following:
|
NOTE: The minimum server requirements listed assume default configuration. Significantly increasing the poll rate or statistic collection rate could result in additional load on the server, which may require a larger CPU or additional memory.
Screenshots:
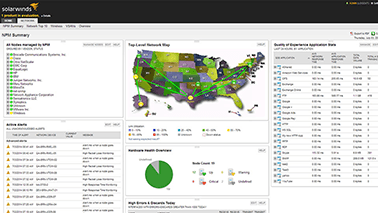
Network availability and performance monitoring
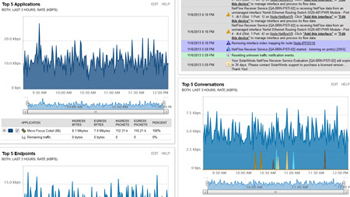
Monitor network device and interface availability and performance indicators.
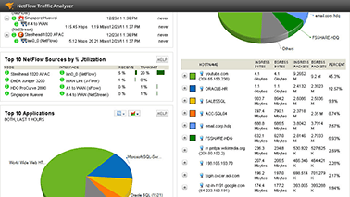
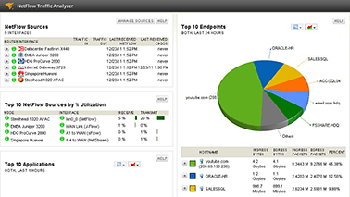
Flow based network traffic analysis
Analyzes Cisco NetFlow, Juniper J-Flow, IPFIX, sFlow, Huawei NetStream and other flow data.
Bandwidth usage by application
Application mapping that provides insights into which applications are consuming the most bandwidth.
Intelligent topology aware alerting
Alert on correlated events, sustained conditions, and complex combinations of device states.
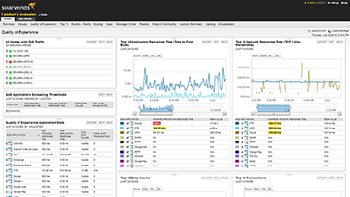
Deep packet inspection and quality of experience
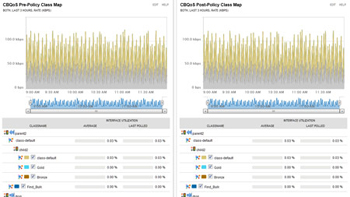
Identify changes in app performance and determine if they are caused by the app or the network.
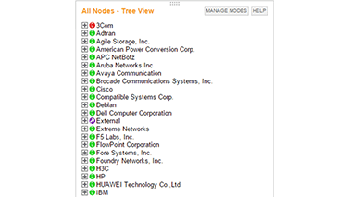
Multi-vendor device support
Heterogeneous network out-of-the-box support for devices from leading hardware vendors.
Traffic analysis dashboard
Comprehensive, customizable view of your network traffic on a single page.
Network traffic forensics
Drill down into any element's traffic to analyze patterns over months, days, or minutes.
Documentation:
Download the Solarwinds Network Performance Monitor Datasheet (.PDF)
Download the Solarwinds NetFlow Traffic Analyzer Datasheet (.PDF)

